

What is a vulnerability scanning report?
A vulnerability scanning report is a structured summary of everything a vulnerability scanner found in your environment. This means it tells you what is vulnerable, how bad it is, and what you should do next.
You can think of it as the "lab results" for your security scan. The scanner does the technical work in the background; the report is what you actually read and act on.
Most reports follow a similar pattern:
Summary: high‑level view of risk and key numbers
Details: list of vulnerabilities on specific assets
Guidance: clear steps to fix or reduce the risk
If your team runs vulnerability scanning but never turns the results into a report, you are missing the main value of the process.
AWS Vulnerability Management Best Practices
This 8-page cheat sheet breaks down the critical steps to fortifying your AWS security posture. From asset discovery and agentless scanning to risk-based prioritization and patch management, it covers the essential strategies needed to safeguard your AWS workloads.

Main sections inside a vulnerability scanning report
Most tools break the report into predictable sections. Once you know what each one does, it's much easier to scan the report quickly and not get lost.
Executive summary
The executive summary is the quick story of the scan. It usually includes total vulnerabilities, how many are critical or high, and a short description of the biggest risks.
This section is written for leaders and non‑technical stakeholders. It should answer, in plain English, "Are we in trouble right now?" and "Are things getting better or worse?"
Here's an example executive summary:
'This month's scan covered 1,247 cloud assets across production and staging environments in AWS and Azure. We identified 89 new vulnerabilities: 3 critical, 12 high, 31 medium, and 43 low. All 3 critical findings are on internet-facing web servers and appear in CISA's Known Exploited Vulnerabilities catalog—these require patching within 7 days per our SLA. The development team has already deployed fixes to staging and will promote to production this Friday. Overall vulnerability count decreased 15% from last month, and we closed 94% of critical/high findings within SLA. Top risk this month: an RCE vulnerability (CVE-2024-1234) on our customer portal that could allow unauthenticated attackers to access session tokens.'
Scope and methodology
Scope is what you chose to scan. Methodology is how the scanner actually did it.
A good scope and methodology section will cover:
In‑scope assets: IP ranges, domains, cloud accounts, clusters, apps
Scan types: internal vs external, authenticated vs unauthenticated
Limitations: what was not scanned or where access was restricted
You use this section to sanity‑check that the scan matched your expectations. If your key production account is missing from scope, you know the report is incomplete.
Asset inventory
The asset inventory lists every system the scanner saw. In a cloud‑native setup, this often includes virtual machines, containers, serverless functions, databases, and load balancers.
Useful reports don't just list hostnames. They also attach labels such as:
Environment (prod, staging, dev)
Application or service name
Owner team or business unit
This mapping is what lets you later route work to the right people instead of guessing who owns "ip‑10‑0‑3‑47".
Vulnerability findings
The findings section is where the scanner shows its work. Each entry usually represents one vulnerability type on one or more assets.
For each finding you'll typically see:
Name and ID: like a CVE number or vendor advisory
Severity and score: critical, high, medium, low plus a CVSS score
Description: what the vulnerability is and why it matters
Affected assets: which systems, images, or apps are impacted
References: links or IDs you can use to look up more detail
This is where your technical teams will spend most of their time.
Risk ratings and prioritization
Risk ratings explain how the report decided what matters most. Basic reports rely only on severity scores. Better reports take your environment into account.
Attack path context: The most effective reports prioritize findings that form complete attack paths by correlating exposure (internet-facing), vulnerabilities (exploitable flaws), identities (excessive permissions), and data sensitivity (access to customer data or credentials). A medium-severity vulnerability on an internet-exposed server with admin permissions to your production database represents higher real risk than a critical vulnerability on an isolated development box.
You might see:
Separate "Top risks" or "Must fix now" sections
Business impact tags such as "customer‑facing" or "payments system"
Flags for vulnerabilities with known exploits, specifically those listed in CISA's Known Exploited Vulnerabilities (KEV) catalog or showing high EPSS (Exploit Prediction Scoring System) probability scores above 0.2
This part tells you which issues are urgent and which can safely wait.
Remediation guidance
Remediation guidance is the "how to fix it" section. For each important vulnerability, the report should give you clear, step‑by‑step advice.
That advice might look like:
"Update package X to version Y or later"
"Change configuration Z from open to restricted"
"Rotate this credential and tighten its permissions"
If your report stops at "this is bad" and never reaches "here's what to do," engineers will struggle to take action.
Metrics and trends
Finally, many reports include a metrics section so you can see changes over time.
Common metrics include (and should be tracked against defined SLAs where relevant):
Number of open vulnerabilities by severity
Average time to fix critical or high issues
Comparison between teams, regions, or environments
These trend lines are helpful for leadership and for you when you want to show progress.
Single prioritized risk queue: Track risk burn-down from a unified, deduplicated queue so leadership sees posture change, not noise. Instead of separate trend lines for vulnerabilities, misconfigurations, and secrets, show one risk score that accounts for all issues weighted by exploitability, exposure, and business impact.
Key performance indicators and SLAs
Define clear KPIs and SLAs so your team knows what success looks like:
Remediation SLAs by severity:
Critical: 7 days (internet-facing), 14 days (internal)
High: 30 days
Medium: 90 days
Low: 180 days or next maintenance window
Core KPIs to track:
Mean time to remediate (MTTR) by severity
% vulnerabilities closed within SLA (target: >95% for critical/high)
Risk burn-down rate (vulnerabilities closed per week)
Coverage metrics (% assets scanned, % authenticated scans)
Exception aging (open risk acceptances >90 days old)
Re-open rate (% vulnerabilities that reappear after closure)
Leading indicators:
Time from scan completion to ticket creation
Time from ticket creation to owner assignment
% findings with automated remediation available
Track these monthly and review trends quarterly with leadership. If MTTR increases or SLA compliance drops below 90%, investigate whether you need more automation, better prioritization, or additional resources.
Watch 12-min demo
Learn how Wiz Cloud surfaces toxic combinations across misconfigurations, identities, vulnerabilities, and data—so you can take action fast.
Watch now
Vulnerability scanning report template and checklist
Here's a one-page checklist you can use to structure your own reports:
Executive Summary
Total vulnerabilities by severity (critical, high, medium, low)
Top 3–5 risks requiring immediate action
Trend vs. previous scan (improving, stable, declining)
SLA compliance status (% critical fixed within 7 days, % high within 30 days)
Scope and Methodology
Assets scanned (IP ranges, cloud accounts, regions, clusters)
Scan types (authenticated vs. unauthenticated, internal vs. external)
Tools and versions used
Limitations and exclusions
Asset Inventory
Total assets discovered
Assets by environment (production, staging, development)
Assets by owner team or business unit
New assets since last scan
Vulnerability Findings
CVE ID and name
CVSS score and severity
EPSS probability and CISA KEV status
Affected assets (hostname, IP, image, function)
Exposure context (internet-facing, internal, isolated)
References and vendor advisories
Risk Prioritization
Attack path analysis (exposure + vulnerability + permissions + data access)
Business impact classification (customer-facing, revenue-critical, compliance-required)
Exploitability signals (KEV, EPSS > 0.2, proof-of-concept available)
Reachability to sensitive data stores
Remediation Guidance
Specific fix steps (patch version, configuration change, permission adjustment)
Assigned owner (team, individual, ticket ID)
Due date based on severity SLA
Workarounds or compensating controls if patching is delayed
Metrics and Trends
Mean time to remediate (MTTR) by severity
% vulnerabilities closed within SLA
Risk burn-down rate (vulnerabilities closed per week)
Coverage percentage (% assets scanned with authentication)
Exception aging (open risk acceptances > 90 days)
Compliance Mapping
SOC 2 Type II evidence (vulnerability management controls)
ISO 27001 Annex A.12.6.1 (technical vulnerability management)
NIST 800-53 RA-5 (vulnerability scanning), SI-2 (flaw remediation)
PCI DSS 11.2 (quarterly scans, scans after significant changes)
Exceptions and Risk Acceptance
Accepted risks with business justification
Compensating controls in place
Exception expiration dates
Re-evaluation schedule
15 Vulnerability Management Metrics to Measure your Program
Vulnerability management metrics are performance metrics that help businesses evaluate their vulnerability management program.
Leggi di piùHow to read a vulnerability scanning report without getting lost
The first time you open a full report, it can feel like a wall of information. Here is a simple order to follow so you make sense of it quickly.
1. Skim the executive summary
Start with the executive summary to get the big picture. Focus on the critical and high‑severity counts and any highlighted "top risks".
Ask yourself:
Do we have any critical issues on internet‑facing systems?
Are there any urgent items called out with specific deadlines?
If the summary sounds alarming, you know you need to dive deeper.
2. Check that the scope matches reality
Next, look at the scope and methodology. Confirm that the right networks, cloud accounts, regions, and environments were included.
If, for example, production Kubernetes clusters are missing from scope, your report is giving you a false sense of safety. It is better to catch that now and re‑run a broader scan.
3. Identify the assets that matter most
Use the asset inventory to spot your most important systems. These are usually:
Production workloads
Internet‑facing services
Identity providers and admin consoles
Databases or storage with sensitive data
When you later review vulnerabilities, you will want to focus on these assets first.
4. Focus on the top findings by risk
Move into the findings section, but don't try to read everything line by line. Start with any "Top 10 findings" or "Critical issues" views.
For each top finding, look for:
Impact if someone exploited it
Whether the affected asset is exposed to the internet
Whether there are known exploits in the wild, verified through CISA KEV listings or EPSS probability scores above 0.2, which indicate active exploitation or high likelihood of exploitation
You are trying to separate "we should fix this soon" from "we must fix this now".
5. Map issues to owners
A report is not useful if nobody knows who should act on it. Once you understand the top risks, figure out which teams own the affected assets.
Sometimes the report helps with this by including tags or owner fields. In other cases, you may need to rely on naming conventions or a separate CMDB.
Owner mapping via code-to-cloud: Modern reports use repository, CI/CD pipeline, project, and service tags to automatically assign tickets to the right teams. For example, if a vulnerable container image traces back to the 'payments-api' repository owned by the payments team, the report can auto-route the finding to that team's backlog with the specific Dockerfile and base image that needs updating.
This is where code‑to‑cloud context really helps. If you can see that a vulnerable container image came from a specific repository, you can route the ticket straight to that dev team.
6. Turn the report into a real backlog
Finally, convert the report into a prioritized list of remediation tasks. Many teams group items like this:
Critical issues on internet‑facing or highly sensitive systems
High‑severity issues on production systems
Medium issues on exposed or important systems
Remaining issues on lower‑risk assets
Push these tasks into the tools your teams already use—create Jira tickets with severity labels and due dates, ServiceNow incidents with assignment groups and SLAs, or GitHub Issues linked to specific repositories. Include the CVE ID, affected asset, owner team, fix guidance, and due date in each ticket. Automate this push where possible so findings flow directly from scanner to backlog without manual CSV exports.
Vulnerability Threat Intelligence Explained: Turning Data into Defense
Vulnerability threat intelligence is the practice of combining vulnerability assessment data with real-world threat information to understand which security weaknesses actually matter.
Leggi di più
Going from "lots of findings" to "real risk"
Not every vulnerability in the report is equally dangerous. Two findings with the same CVSS score can have very different real‑world impact depending on where they live.
Technical risk vs business risk
Technical risk is about how severe the vulnerability is in theory. Business risk is about what it could do to your specific environment.
When you look at a finding, ask:
Is the affected system reachable from outside your network?
Does it have wide or admin permissions in your cloud?
Can it reach important data stores or critical services?
A medium severity bug on your public login service may be more important than a critical bug on an isolated test box.
Exploitability signals: EPSS and CISA KEV
Not all vulnerabilities are equally likely to be exploited. Two key signals help you focus on real-world threats:
CISA Known Exploited Vulnerabilities (KEV): The U.S. Cybersecurity and Infrastructure Security Agency maintains a catalog of CVEs with confirmed active exploitation. If a vulnerability appears in the KEV catalog, threat actors are already using it in attacks. Federal agencies must patch KEV-listed vulnerabilities within 15 days for internet-facing systems and 30 days for internal systems—a good benchmark for any organization.
Exploit Prediction Scoring System (EPSS): EPSS assigns a probability score (0.0 to 1.0) indicating the likelihood a vulnerability will be exploited in the next 30 days. Scores above 0.2 (20% probability) warrant immediate attention. EPSS combines threat intelligence, exploit availability, and historical exploitation patterns to predict risk more accurately than CVSS severity alone.
Combine these signals with your asset context:
KEV + internet-facing + admin permissions = fix immediately
EPSS > 0.5 + production + sensitive data access = fix within 7 days
CVSS 9.0 + EPSS < 0.01 + isolated dev environment = fix within 30 days
This approach reduces remediation noise by 60–80% compared to fixing all "critical" findings regardless of exploitability.
How modern reports add context
Newer tools try to add this context directly into the vulnerability scanner report. They look at:
Network exposure: security groups, firewalls, ingress rules
Identity and permissions: roles, service accounts, trust relationships
Data paths: reachable databases, buckets, or message queues
Combinations: where a vulnerability plus a misconfiguration plus a secret create a full attack path
When a report highlights those "toxic combinations," it becomes much easier to decide what to fix first.
What is different in cloud vulnerability scanning reports
Cloud and container environments are more dynamic than traditional on‑premises networks. That changes what a good report needs to show.
Agentless discovery
In the cloud, you can't assume every workload has an agent installed. Agentless scanning uses cloud provider APIs and disk snapshots to inventory and assess resources without installing software agents on each machine, enabling broad coverage across ephemeral and immutable workloads.
In reports, this shows up as broader coverage:
Agentless across clouds: Use API-based discovery for AWS, Azure, GCP, and Kubernetes to eliminate blind spots without deployment friction. This approach inventories virtual machines, containers, serverless functions, managed databases, and storage—all without installing agents that require maintenance or create performance overhead.
Virtual machines and hosts
Containers and images in registries
Serverless functions and managed services
When coverage is validated across all cloud accounts, regions, and services, you can trust the report much more—while still watching for blind spots like short-lived containers (under 5 minutes), disabled API logging, or workloads in disconnected VPCs.
What is cloud vulnerability scanning? Modern best practices
Cloud vulnerability scanning is the automated process of identifying security flaws within your cloud infrastructure, workloads, and configurations. Unlike traditional scanning designed for static, on-premises servers, cloud scanning is built to handle the dynamic nature of the cloud.
Leggi di più

Coverage across the whole lifecycle
Cloud‑native apps introduce risk in code, container images, and runtime environments. A strong report surfaces issues across that lifecycle and leverages Software Bill of Materials (SBOM) and Vulnerability Exploitability eXchange (VEX) documents to qualify which components are actually loaded and exploitable:
Vulnerable libraries in your source code and dependencies
Old or unpatched base images in your registries
Host and container vulnerabilities in running environments
Misconfigurations in IaC templates and cloud control planes
This is where vulnerability scanning, configuration scanning, and permissions analysis start to blend together.
Normalized view across clouds
If you use more than one cloud, you don't want three totally different report styles. Normalized reports use common names and severity models so you can compare risk.
For example:
"Virtual machine" instead of cloud‑specific product names
One consistent critical/high/medium/low scale
Shared tags like "production" or "customer‑facing"
This makes it much easier for you to spot patterns and set global standards.
What leadership wants from a vulnerability management report
You and your engineers care about exact CVEs and configs. Your CISO, CTO, or board cares about a different set of questions.
They usually want to know:
Are we reducing our risk over time?
Do we have any obvious gaps or blind spots?
Are we responding quickly enough to serious issues?
Where do we need to invest more?
A good vulnerability management report serves both groups. It gives leadership a clean view of posture and trends while still giving practitioners the raw detail they need to fix things.
Mapping vulnerability reports to compliance frameworks
Auditors and compliance teams need vulnerability reports to demonstrate control effectiveness. Here's how reports map to common frameworks:
SOC 2 Type II
CC6.1 (logical access): Show vulnerability management for identity and access systems
CC7.1 (system monitoring): Demonstrate continuous scanning and alerting
Evidence needed: Scan frequency, remediation SLAs, exception tracking
ISO 27001 Annex A.12.6.1
Technical vulnerability management control
Evidence needed: Vulnerability identification process, prioritization criteria, remediation tracking, management review of vulnerability status
NIST 800-53
RA-5 (Vulnerability Scanning): Scan frequency, coverage, authenticated scans
SI-2 (Flaw Remediation): Remediation timelines, patch management, risk acceptance process
CM-8 (System Inventory): Asset discovery and inventory accuracy
PCI DSS 4.0
Requirement 11.3.1: Quarterly external vulnerability scans by Approved Scanning Vendor (ASV)
Requirement 11.3.2: Scans after significant changes to environment
Requirement 6.3.3: Review of vulnerabilities and assignment of risk rankings
Include a compliance mapping table in your report showing which controls each scan satisfies and when the next scan is due.
How Wiz turns scan data into contextual reports
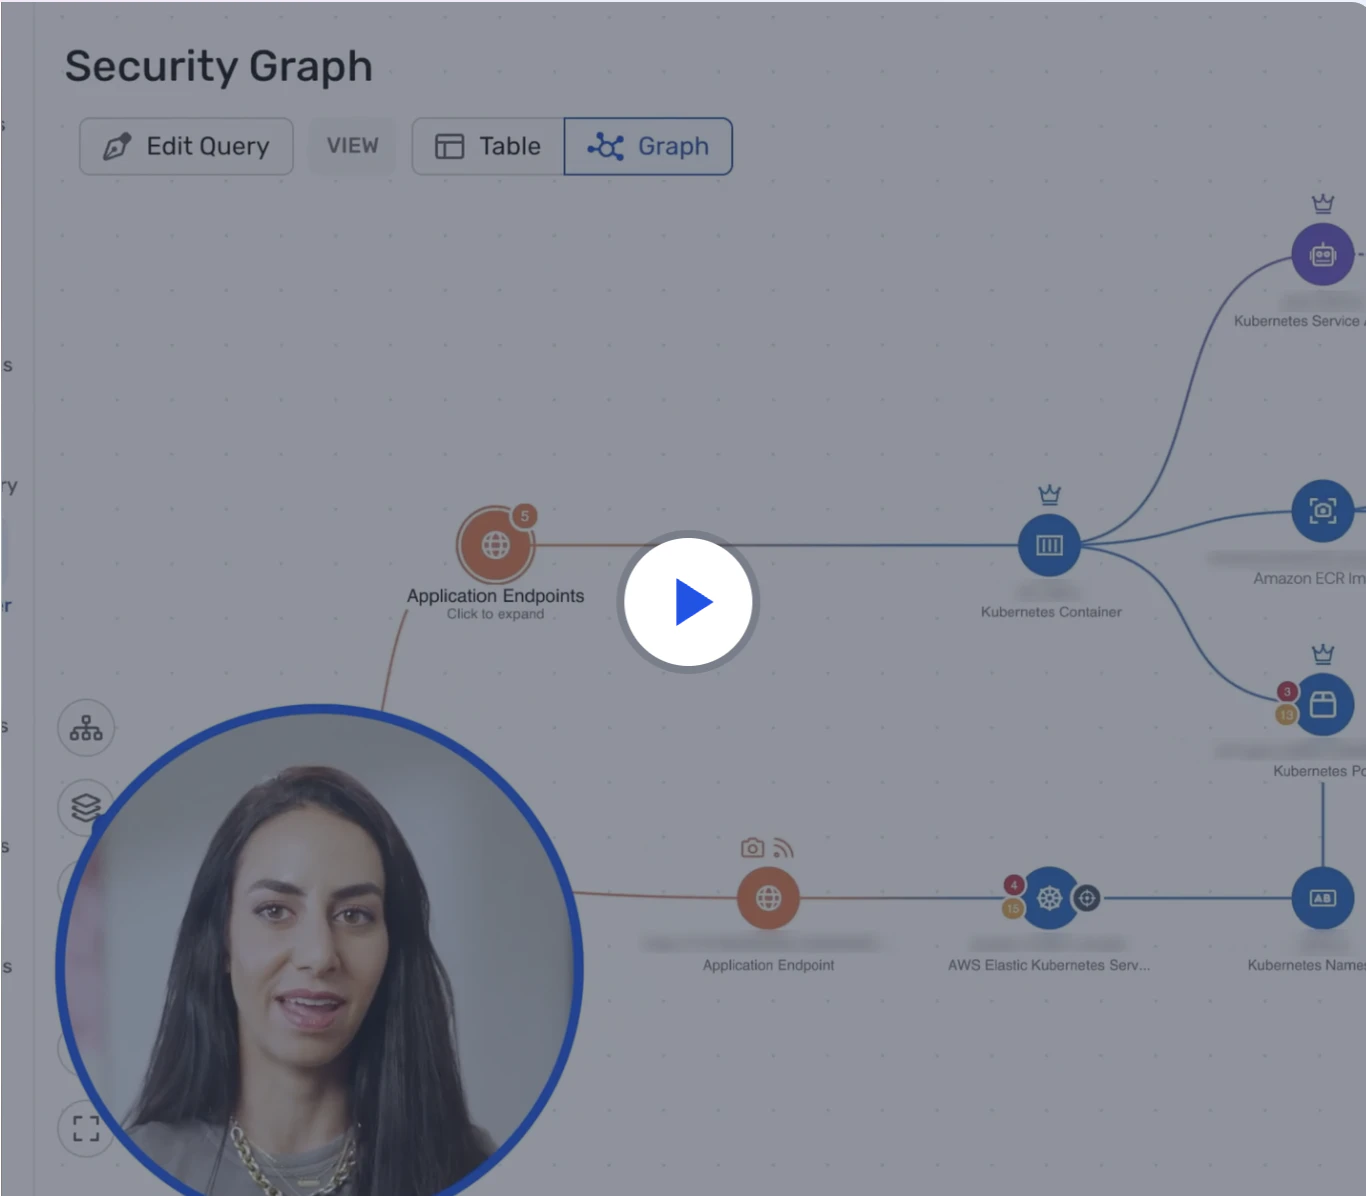
Wiz UVM is built to solve this problem: too many findings, not enough context. It delivers comprehensive coverage and contextual prioritization through an agentless approach across VMs, containers, serverless, and on‑prem resources—enhanced by Wiz Sensor for runtime validation. Instead of just listing CVEs, Wiz builds a Security Graph of your entire environment so you can act on what’s truly exploitable.
The Security Graph connects:
Cloud and on‑prem resources across VMs, containers, serverless, data stores, and identities
Vulnerabilities from agentless Workload Scanning of file systems and dependencies
Source code issues via Wiz Code (native SAST and source code scanning)
Runtime validation signals from Wiz Sensor to confirm actively loaded vulnerable packages
Misconfigurations, exposed secrets, and malware
Network exposure and internet‑facing context, plus identity permissions
Threat intelligence from 20+ continuously updated vulnerability databases, including NIST’s NVD, to highlight known exploits and available fixes
Ingested findings from traditional scanners for a unified view
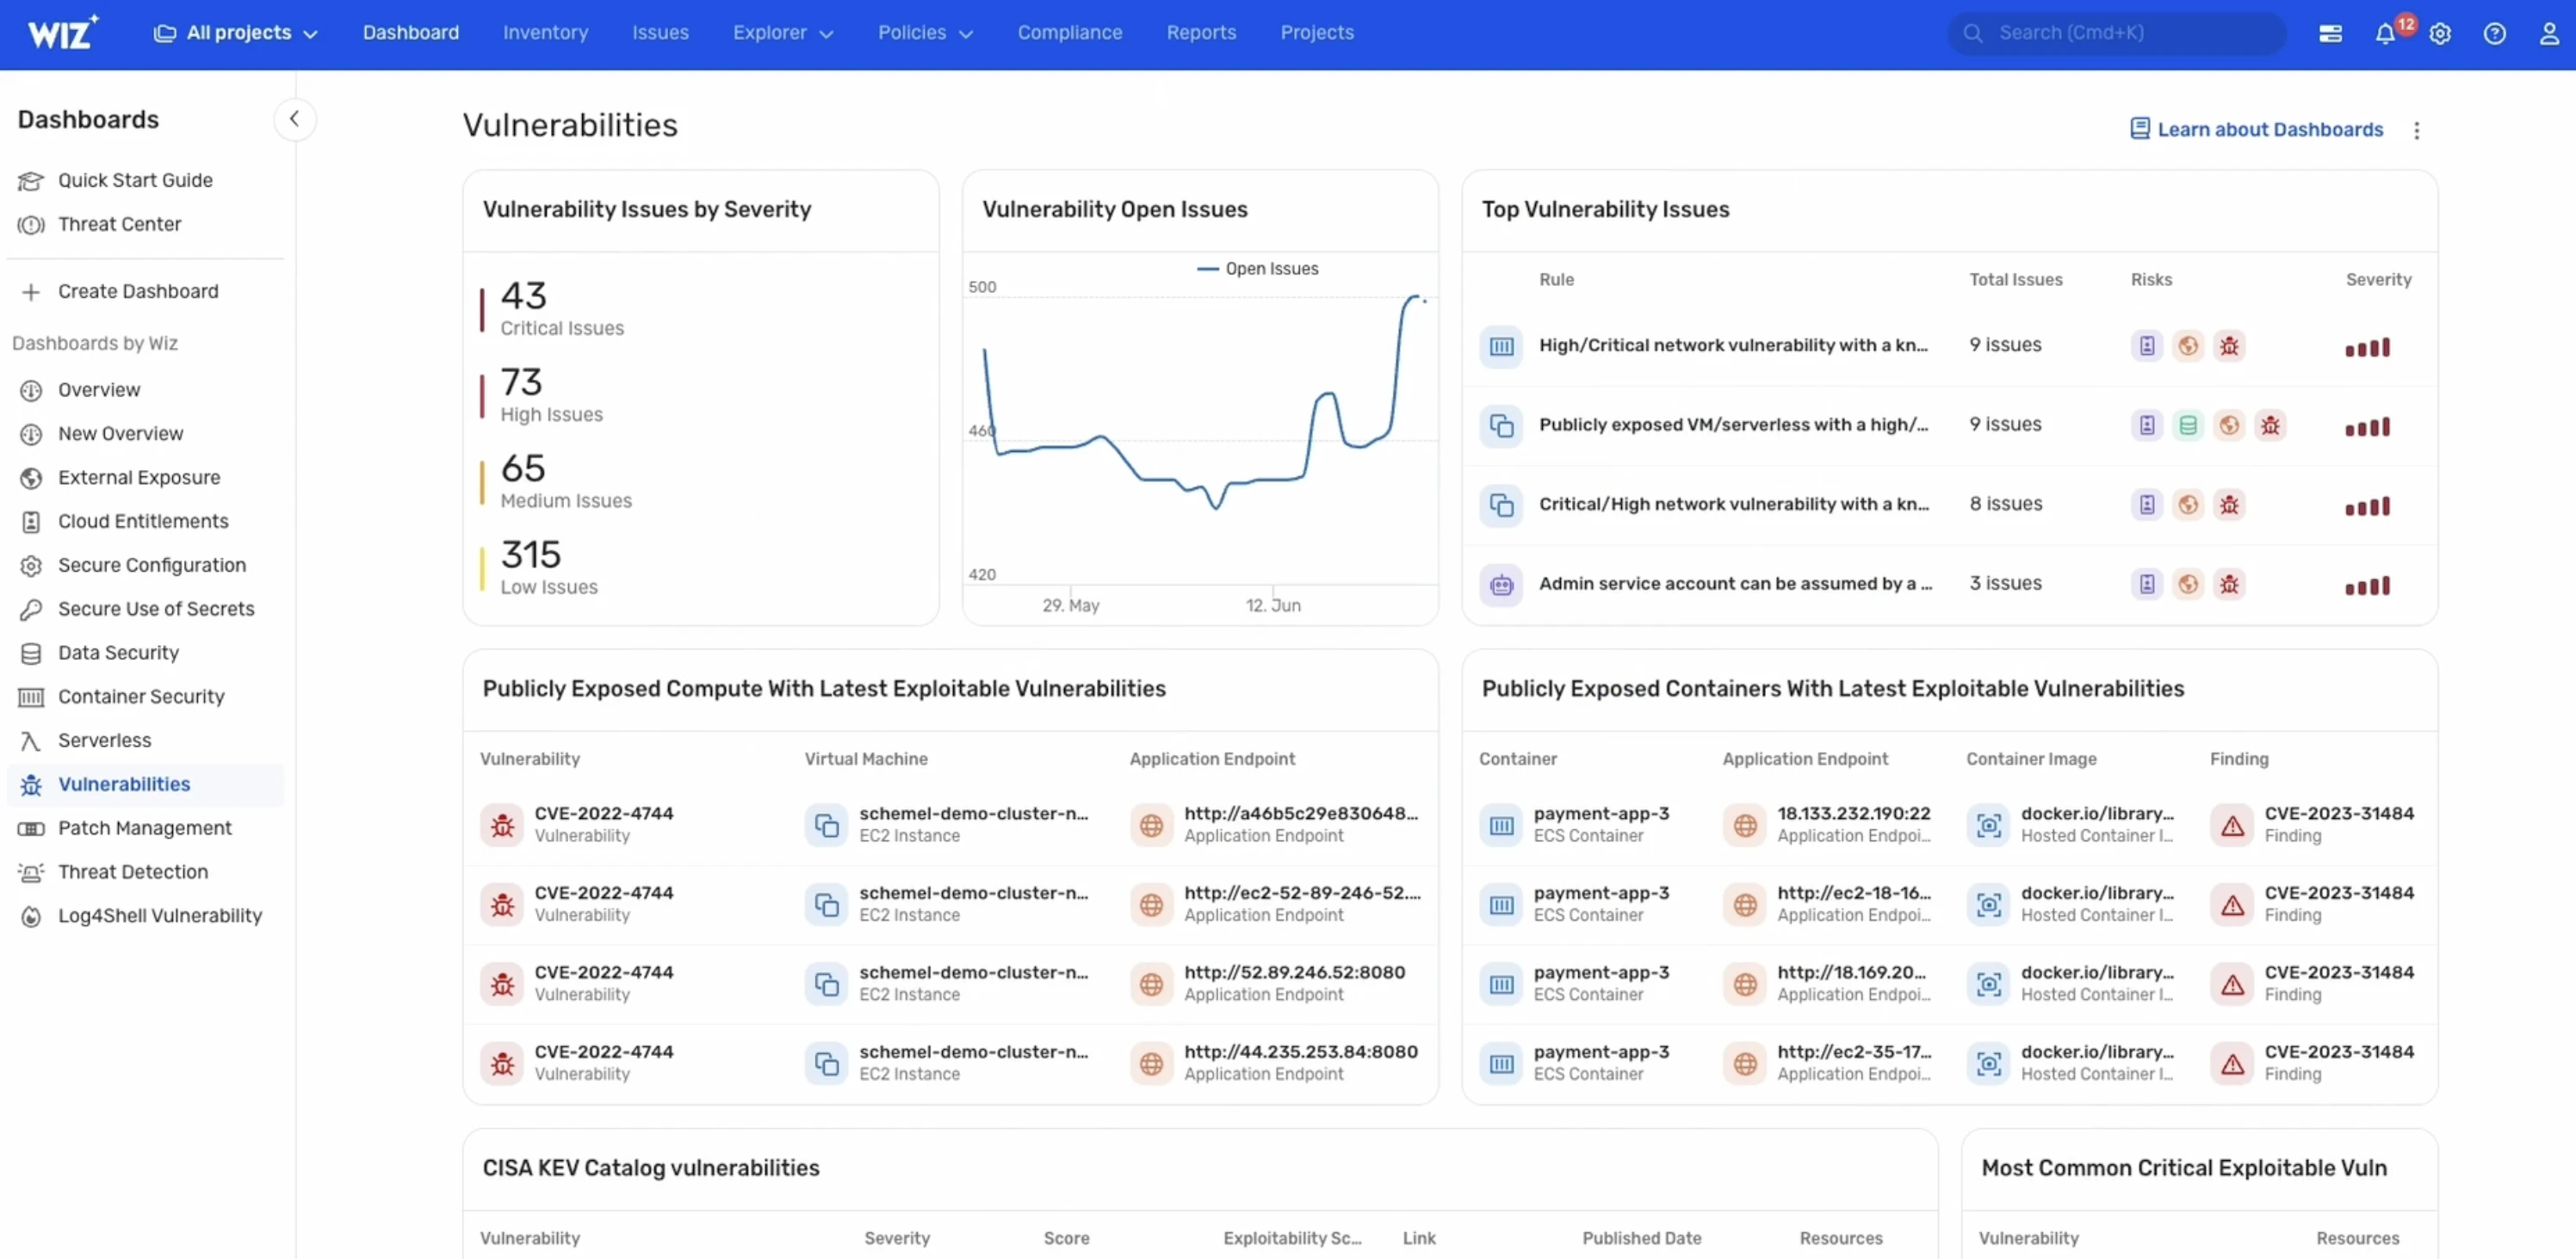
Your “report” becomes a single, prioritized risk queue on top of the Security Graph. Instead of “here are 500 critical CVEs,” you see: “this exposed VM with a critical RCE can reach this sensitive database through this path—fix this first because it represents a complete attack chain.” You can explore, filter, and export directly from the Explorer > Vulnerabilities page, generate CSV or API exports, and produce compliance‑ready POA&M vulnerability reports with detailed CVE data, descriptions, known exploits, and fixes prioritized by severity.
From there, Wiz helps you operationalize:
Assign issues to the right owners using project, service, and repository context—leveraging code-to-cloud lineage to trace arunning workload back to the source code team.
Push fix-ready tasks into your existing ticketing and ITSM workflows, automate notifications through security automation and collaboration channels, and enforce SLAs with deduplicated ticketsand POA&M tracking.
Automate remediation where supported and track progress, exceptions, and overall posture over time across all cloud and on-prem environments.
You get the clarity of a report and the depth of a live, connected view—agentless by design, runtime‑validated with Wiz Sensor, and unified across cloud and on‑prem to drive measurable risk reduction. See how Wiz UVM turns scan noise into prioritized, fix‑ready action—request a demo.
Uncover Vulnerabilities Across Your Cloud
Learn why CISOs at the fastest growing companies choose Wiz to secure their cloud environments.
