

Cloud cost management entails making informed decisions about how your business consumes cloud resources. This involves striking a balance between performance, scalability, and costs via proper resource allocation, optimization, budget enforcement, guardrails, and forecasting.
Cloud spend can easily spiral out of control. The 2025 Flexera “State of the Cloud” report, based on a survey of over 750 executive leaders and technical professionals, revealed that 84% view cloud cost management as their primary challenge, ranking it ahead of even security. This challenge is most acutely felt by FinOps practitioners, cloud engineers, and finance teams struggling to maintain control of the increasing complexity.
AWS offers a range of cloud cost management features to ease the burden on FinOps teams. AWS Budgets and Cost Explorer are two such solutions. Even though both work with the same underlying billing and usage data, they are built for different jobs: Budgets helps with enforcing thresholds and staying ahead of overspending, while Cost Explorer clarifies what’s driving the spend.
This article will help you understand the benefits of using both tools together, along with a solution like Wiz to fill the cross-cloud visibility gap and optimize both costs and security.
2025 Gartner® Market Guide for CNAPP
Download the report to explore where cloud security is headed and what to prioritize in your strategy.

What is AWS Budgets?
AWS Budgets allows you to set financial or usage limits, monitor these limits, and receive automated alerts when you’re about to cross them. With Budgets, you can keep your cloud spend predictable and aligned with business priorities, rather than receiving a surprise invoice at the end of the billing cycle.
AWS Budgets operates on the same billing data cadence as AWS Cost Management, with updates occurring at least once daily. This means alerts and automated actions trigger after thresholds are crossed—not in real time. For example, if your spend crosses 90% of budget at 2 AM, the alert may not arrive until the next billing data refresh, typically 12–24 hours later. This delay is why practitioners commonly set alerts at 80% and 90% thresholds to maintain a safety buffer.
Budgets uses four key budgeting categories based on how customers primarily consume and optimize AWS services:
Cost budgets: Set a currency limit for a time period and get alerts when your cloud spend reaches or crosses the defined threshold.
Usage budgets: Set a resource limit (e.g., GBs of S3 storage, number of EC2 instances) for a time period and receive alerts when the usage reaches a defined threshold.
Reserved Instance (RI) budgets: Receive discounts on eligible services such as Amazon EC2, RDS, Redshift, ElastiCache, and OpenSearch Service in exchange for committing to 1 or 3 years. RI budgets track your RI utilization, notifying you when it falls below the defined threshold.
Savings Plans budgets: Commit to a fixed hourly spend for 1 or 3 years, and AWS applies discounted rates to eligible compute usage across EC2, Fargate, and Lambda. Savings Plans budgets send alerts when your utilization falls below a defined threshold (for example, below 90% of committed spend) and track the percentage of your total compute usage covered by the plan.


What are the key features of AWS Budgets?
After the initial setup and category selection, AWS Budgets offers cost and usage tracking through various features:
Custom budgets: Create tailored budgets that target specific services, accounts, or AWS cost allocation tags.
Alerts: Configure alerts to notify via email, Amazon SNS, or AWS Chatbot (supporting Slack, Microsoft Teams, and Amazon Chime) when your actual or forecasted spend approaches or crosses a defined threshold. Each budget supports up to 10 alert configurations with different thresholds and notification channels.

Budget actions: Configure automated actions to trigger when a defined threshold is reached. For example, apply a restrictive IAM policy to a user, group, or role, or attach a Service Control Policy (SCP) to an account or OU to block costly actions. Pair threshold alerts with owner-aware workflows so the right team receives notifications with precise context—including which resources triggered the alert, who owns them, and what security or compliance implications exist—enabling teams to act quickly without manual investigation.
Security guardrails: Block or limit costly actions by attaching SCPs or restrictive IAM policies when thresholds are crossed. To automatically stop or right-size running resources, integrate Budget alerts with AWS Lambda functions or Systems Manager Automation documents. For example, configure an SNS topic to trigger a Lambda function that stops tagged EC2 instances when the development environment budget reaches 90%.
Forecasting: Predict end-of-period spend from current usage trends and compare it to your defined thresholds. AWS requires approximately 5 weeks (35 days) of historical billing data before forecasts become available. This ensures the machine learning model has sufficient data points to generate statistically reliable predictions for your spending patterns.
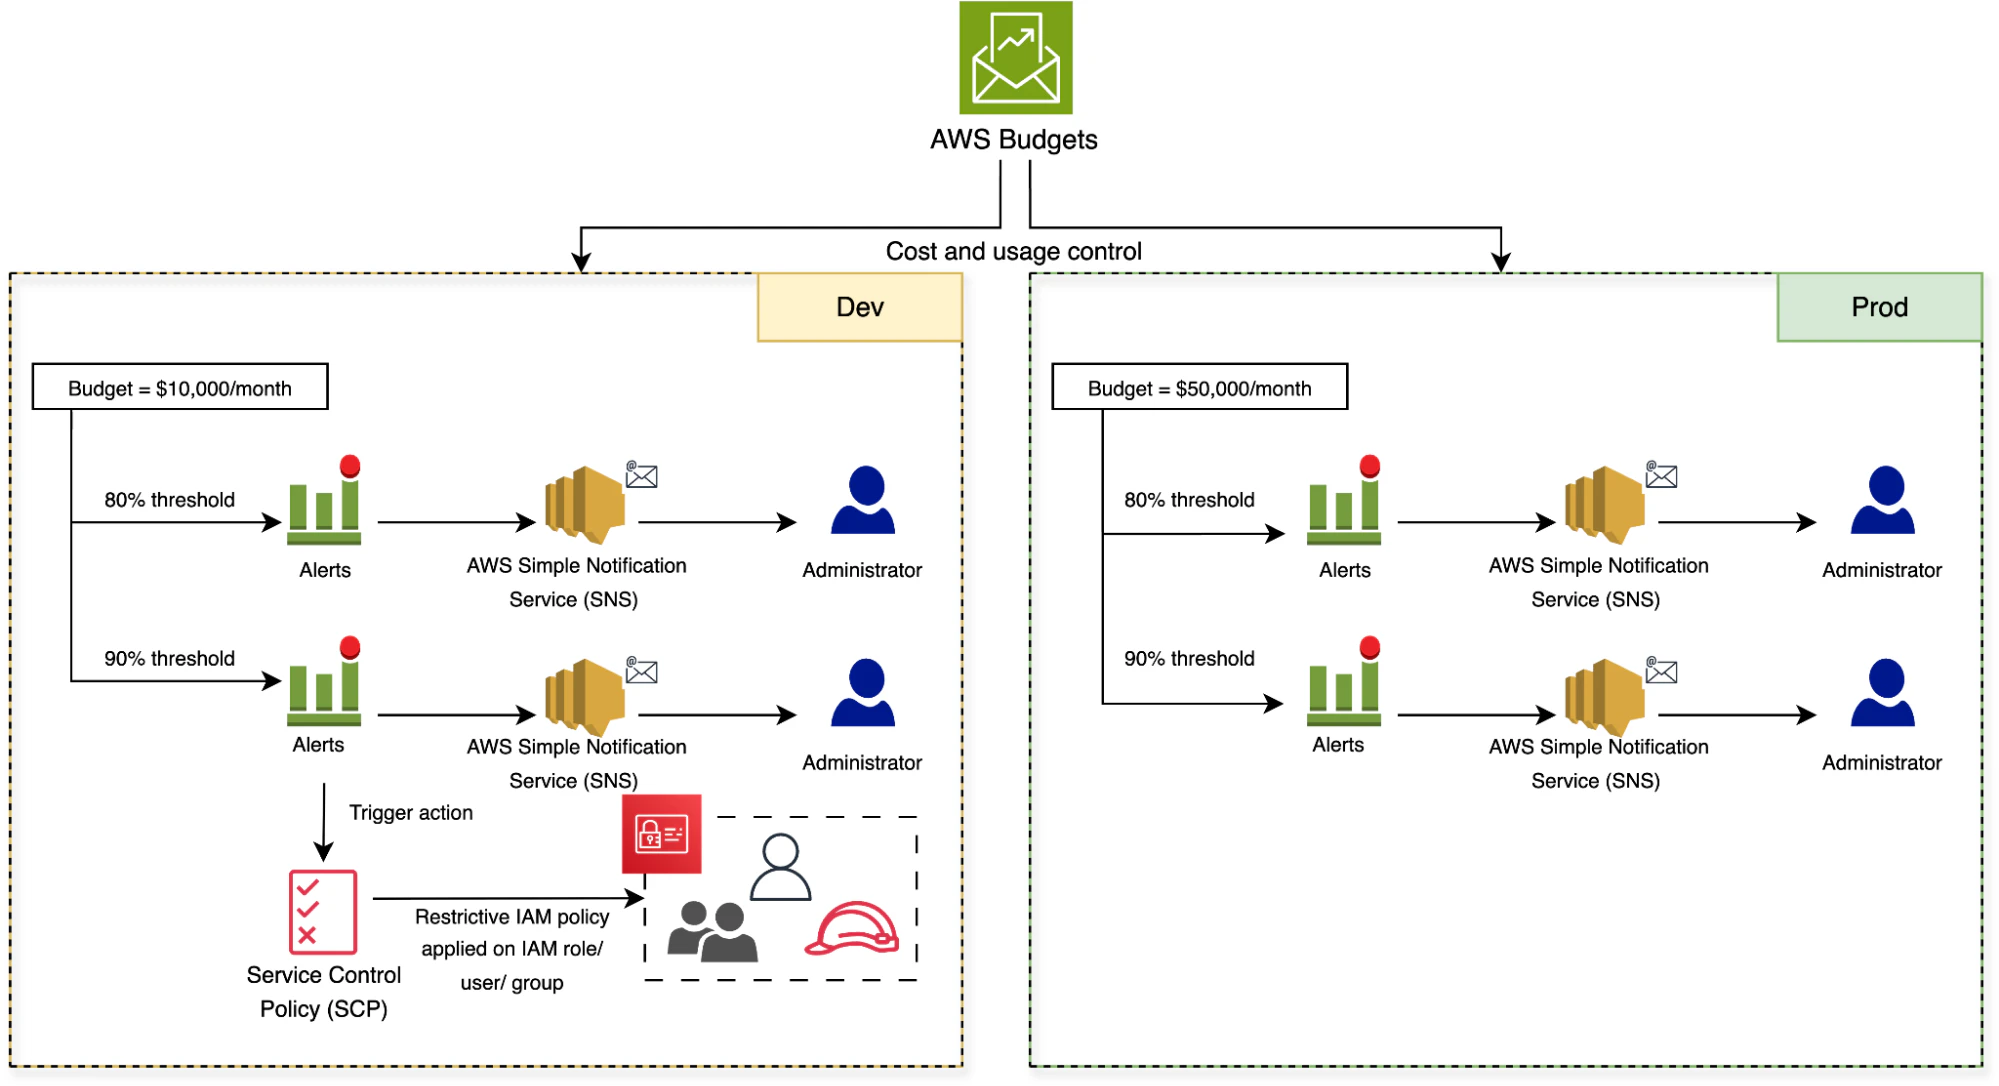
Consider a development environment with a $10,000 monthly budget. To prevent overspend, the FinOps team configures an 80% alert ($8,000 actual spend) to notify the engineering manager via email, and a 90% threshold ($9,000 actual spend) that triggers a Budget Action applying a restrictive IAM policy to block new EC2 instance launches. Meanwhile, the production environment has a $50,000 monthly budget with alerts only—no automated actions—to avoid any risk of service disruption.
What is AWS Cost Explorer?
AWS Cost Explorer helps you visualize, filter, and drill down into your AWS cost and usage data to pinpoint anomalies and identify the drivers of your cloud spend. With Cost Explorer, teams can quickly identify cost patterns, assess usage efficiency, and plan future spending via a dynamic, interactive dashboard.
Similar to AWS Budgets, Cost Explorer does not provide real-time cost data. Most cost and usage views update at least once daily, typically within 24 hours of resource usage. However, some AWS services may exhibit longer processing delays depending on their billing data pipeline. For example, AWS Marketplace charges or cross-region data transfer costs may take an additional 12-24 hours to appear in Cost Explorer.
Cost Explorer organizes your data into three key calculation models, each offering a different view of cloud spend: unblended, amortized costs, and blended costs.
Unblended costs
This is the default cost metric in both Cost Explorer and Budgets. Unblended costs represent the actual usage charges for resources on the day they're billed to your account. Net unblended costs show those same charges after applying discounts (such as Reserved Instance volume discounts or Savings Plans rates) and credits (including promotional credits, service credits for SLA violations, or refunds). For example, if you incur $100 in EC2 charges and have a $20 promotional credit, your net unblended cost is $80.
For example, if you launch a t3.small instance at an hourly rate of $0.02 and run it for 10 hours, your total charge for the day will be $0.20. The unblended cost shows up as $0.20, and the net unblended cost would reflect any discounts applied to that charge.
Amortized costs
Amortized costs distribute the upfront reservation fees and monthly reservation fees evenly across the billing period to show the true daily or monthly effective rate. This way, the reservation fees for Reserved Instances (RI) are not displayed as a single large charge at the beginning of the month, but are instead spread across the month. The net amortized costs reflect the amortized cost after including discounts such as RI volume discounts.
For example, suppose you purchase an RI with a $360 partial upfront fee and a one-year commitment. Instead of seeing a monthly cost spike of around $30 on the first day of each month, the amortized cost for a 30-day month spreads it evenly to display an effective daily cost of around $1 per day.

Blended costs
Blended costs are the least frequently used calculation model. These display the average of total usage cost incurred across all the member accounts of an AWS organization where consolidated billing is enabled. This is calculated by multiplying each member account’s usage by the blended rate. Simply put, the blended rate is the average rate of all on-demand, Reserved Instance, and Savings Plan usage for a particular service.
For example, say you have two member accounts using the same t3.small instance type. Account A runs the instance for 8 hours at $0.02/hour, totaling $0.16. On the other hand, Account B runs the same instance type for 12 hours at a discounted rate of $0.01/hour, totaling $0.12. The total cost is $0.28 for 20 total hours, making the blended rate $0.014 per hour. By multiplying the usage by the blended rate, each member’s blended cost would be $0.112 (Account A) and $0.168 (Account B).
These cost calculation models and their distinct views make Cost Explorer a powerful, interactive tool for deep analysis of cost drivers, uncovering the “why” behind your cloud spend.
Watch 12-minute demo
Learn about the full power of the Wiz cloud security platform. Built to protect your cloud environment from code to runtime.
Watch now
What are the key features of Cost Explorer?
Cost Explorer includes the following capabilities:
Interactive visualizations: View cloud cost as an interactive bar chart, a stacked bar chart, or a line graph, with time-based granularities (hourly, daily, or monthly).
Advanced filters and grouping: Break down cloud spend across services, usage types, availability zones, instance types, regions, linked accounts, resources, or tags for more selective visibility.
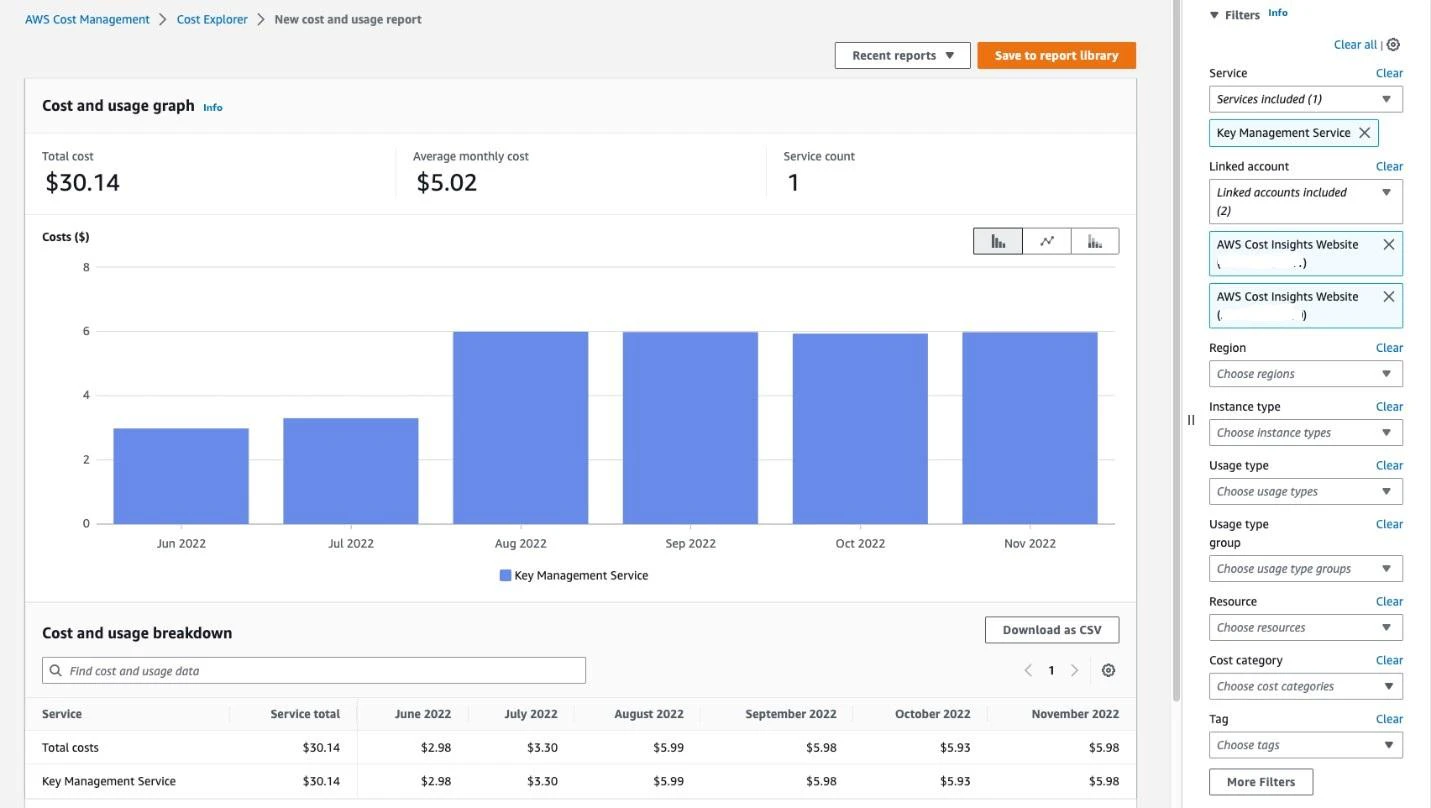
Reports: Access the default range of cost and usage reports and Reserved Instance reports, or generate new, detailed reports with custom filters.
Historical data and forecasting: View cost and usage data of the past 13 months and generate forecasts for up to the next 12 months. Also, get recommendations on what Reserved Instances you can purchase based on usage predictions.
Cost comparison: Automatically analyze the difference in cloud costs between two different months to identify spending changes, causes, trends, and the biggest cost drivers.
Cost anomaly detection: AWS Cost Anomaly Detection (a separate service that integrates with Cost Explorer) automatically identifies unusual spending patterns using machine learning analysis of your historical billing data. The service generates alerts when it detects anomalies—such as a sudden 50% spike in S3 storage costs—and routes notifications through Amazon SNS or AWS Chatbot. You can view detected anomalies in the Cost Explorer console and drill down to investigate root causes.
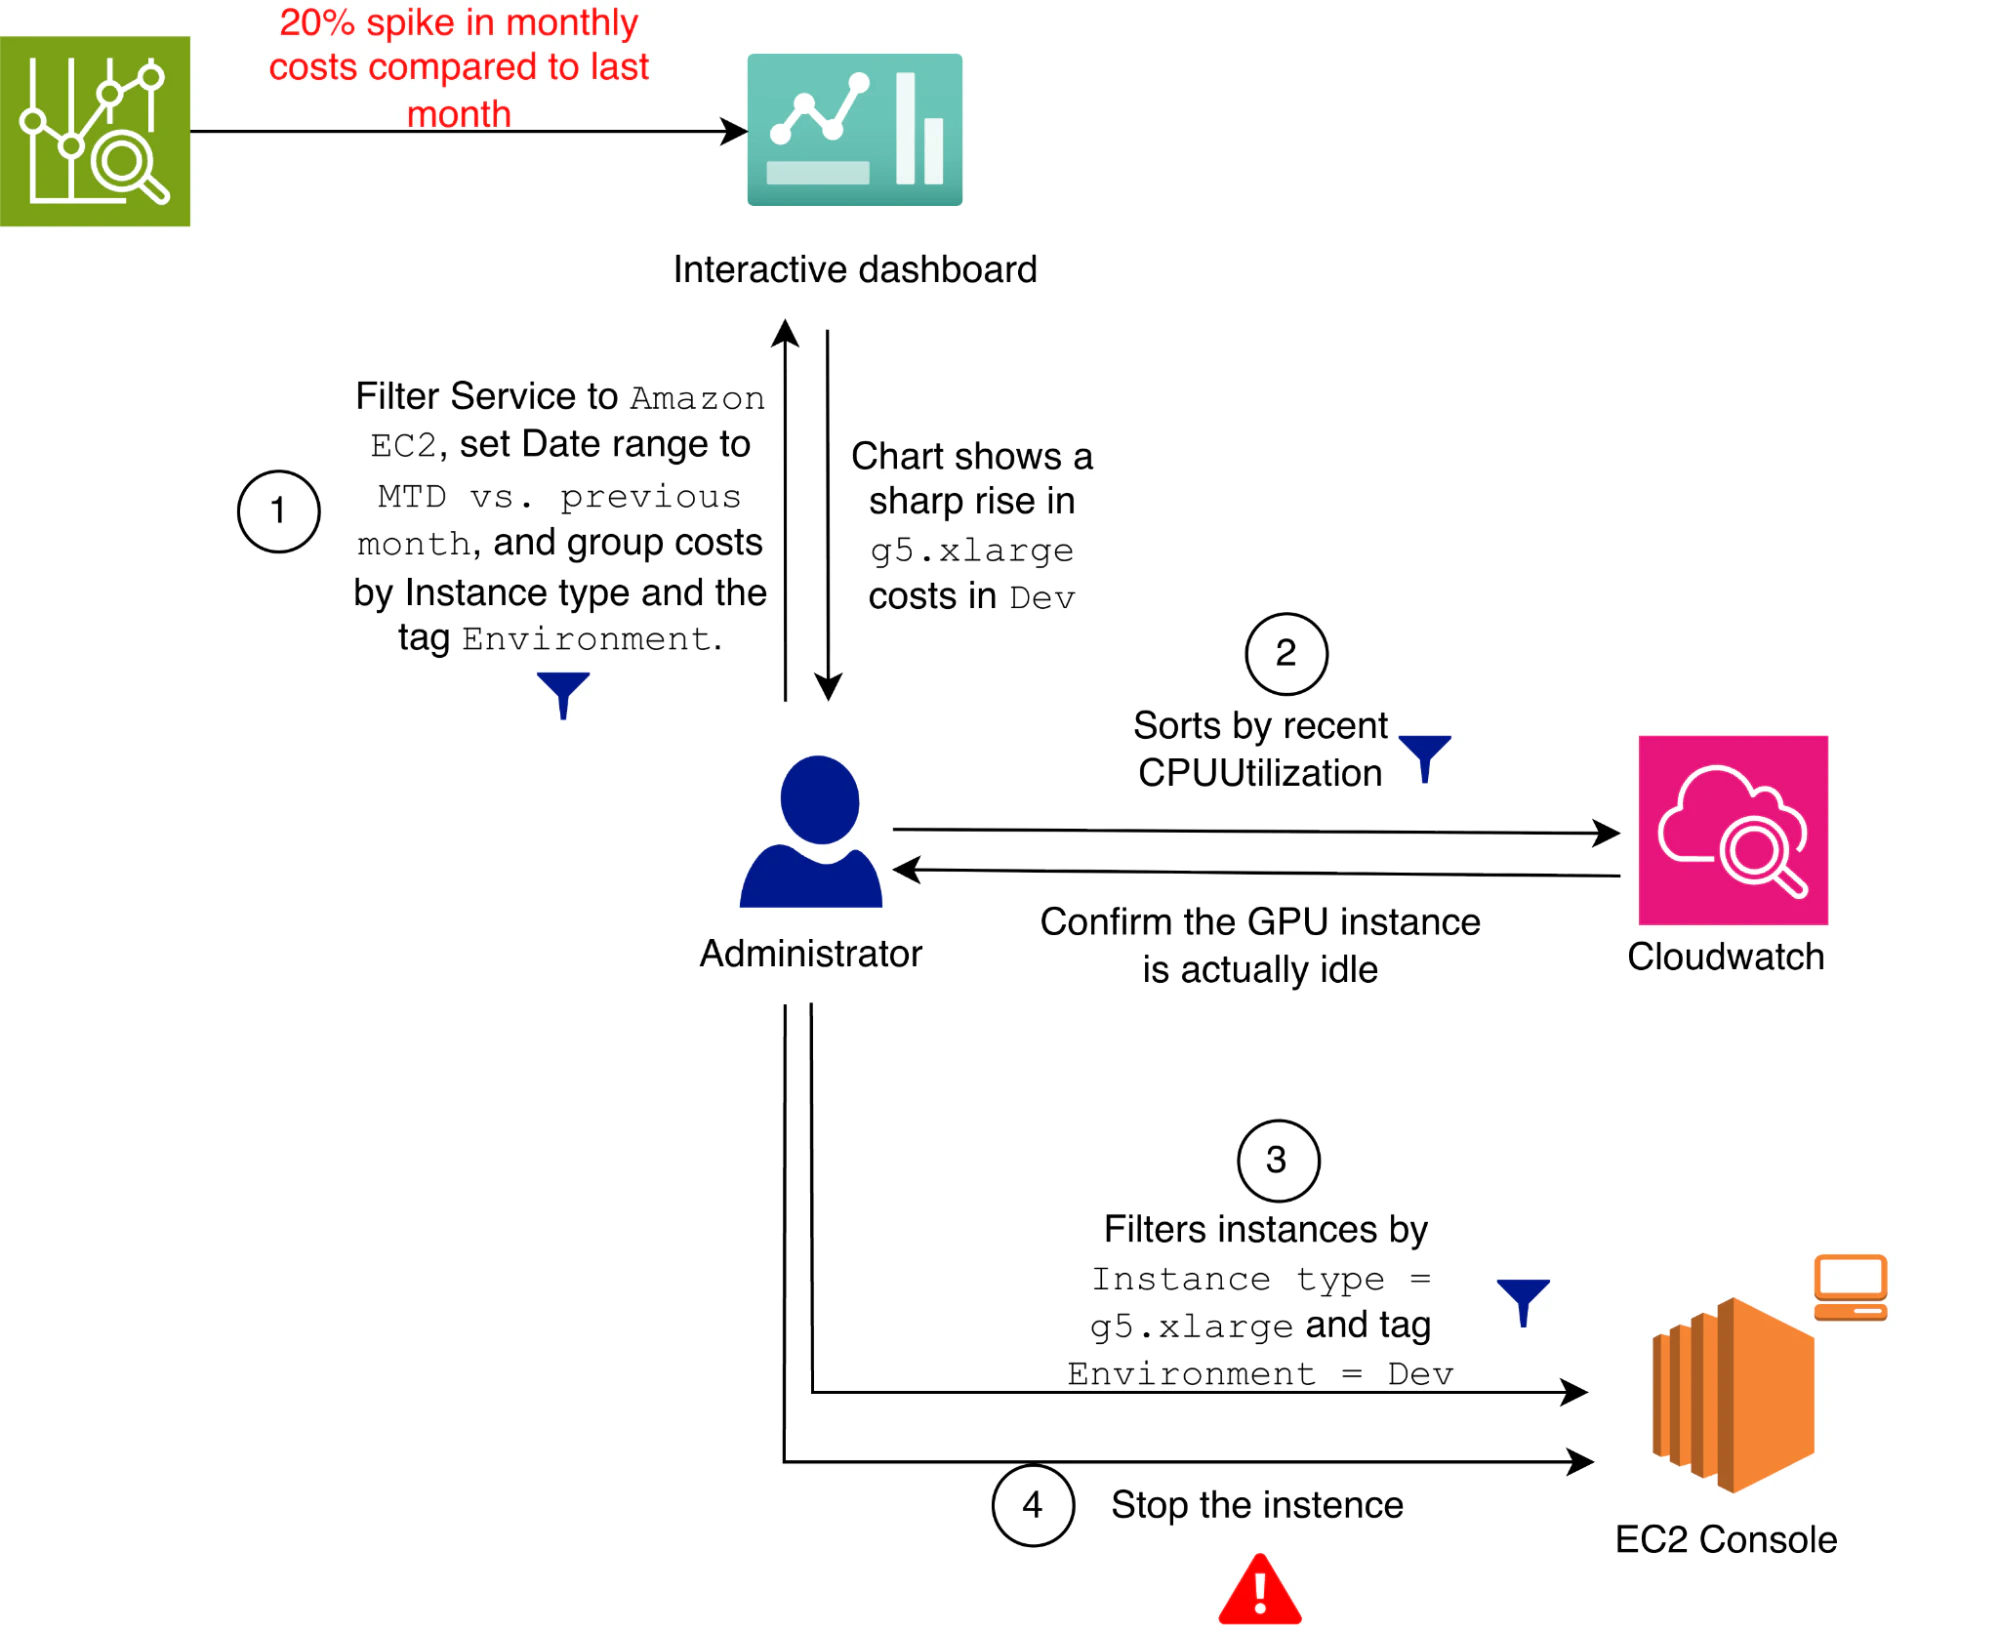
Cost comparison example scenario: Imagine an administrator sees a 20% month-over-month spike in EC2 costs in Cost Explorer. In the interactive dashboard, they filter to Service = Amazon EC2 and then group by Instance type and the Environment tag to identify the root cause.
Assume the view highlights g5.xlarge usage in the Dev environment.
So now the administrator can open the EC2 console, find the tagged instance, confirm low utilization in CloudWatch, and stop or terminate the idle instance.
Budgets vs. Cost Explorer: How do they compare?
AWS Budgets and Cost Explorer solve different parts of the same puzzle: Budgets focuses on keeping teams aligned with predefined limits, while Cost Explorer focuses more on providing detailed information on what is driving costs.
Both tools complement each other to strengthen overall cloud cost governance, which is why it is recommended to use them together.
| Aspect | AWS Budgets | AWS Cost Explorer |
|---|---|---|
| Purpose | Proactive cloud spending controls by setting cost and usage budgets with alerts and automated actions | Reactive insights by analyzing historical and forecasted usage data for cost investigation |
| Primary use case | Enforcing financial guardrails, preventing overspend, and ensuring teams stay within planned budgets | Breaking down costs, understanding what drives cloud spend, and identifying anomalies and trends |
| Approach | Forward-looking, where Budgets monitors, sends alerts, and initiates actions based on defined thresholds | Both backward and forward-looking, enabling review of current, historical, and forecasted cost data |
| Usage insights | Directly linked to defined budget thresholds | Broader range of insights with custom filtering, in-depth details, data comparisons over time, and usage patterns |
| Alerts & actions | Robust alerting system for predefined thresholds, automated actions associated with alerts | No specific alert and action capabilities, emphasis on data visualization and reporting |
| Forecasting | Basic forecasting based on current usage data to compare against thresholds | Comprehensive forecasting for up to 12 months out based on historical cost data |
| Ideal for | Setting precise budget limitations | Conducting detailed cost analyses for cost optimization |
Knowing the individual perks of each tool, you can now decide on how to incorporate Budgets, Cost Explorer, or both into your cloud cost management efforts.
Knowing the individual perks of each tool, you can now decide how to incorporate Budgets, Cost Explorer, or both into your cost management efforts. Often, the sweet spot is to pair Budgets (for thresholds and enforcement) with Cost Explorer (for investigation) and then add code-to-cloud context to connect cost signals to resource ownership, security risk, and remediation workflows. Layering ownership context helps you route cost optimization tasks to the right teams faster and avoid reverting 'savings' that break reliability or security.

Optimize cloud cost management with Wiz
AWS Budgets and Cost Explorer together create a strong foundation for cost governance. However, most organizations operate in increasingly complex environments that span multiple AWS accounts, regions, or even multiple clouds. Achieving unified governance requires code-to-cloud visibility to see and secure all your assets.
Despite the powerful features of AWS-native tools, they are not enough for the full cross-cloud visibility you need for strategic decision making. Also, they lack a unified approach that maps security, cost, and governance into a unified workflow.
Wiz fills this gap with Wiz Cloud Cost, which brings cross-cloud cost visibility, optimization opportunities, and ownership context into the Wiz Security Graph to improve both cost management and cloud security posture. For example, Wiz can surface an unused EC2 instance as a savings opportunity and simultaneously identify that the associated IAM role has overly permissive access to production databases. The graph shows the resource owner, the instance's network exposure, and its connection to sensitive data, allowing you to remove both the waste and the risk in a single workflow routed to the right team.
Wiz's agentless, graph-based approach scans your entire cloud environment without requiring agents on every resource. This ensures broad coverage across compute, storage, databases, serverless functions, and Kubernetes. With Wiz Cloud Cost, teams can investigate spend across AWS, Azure, GCP, and Kubernetes, see cost drivers in the Wiz Security Graph, and prioritize savings opportunities based on utilization, ownership, and related risk. That same context is especially useful for newer AI workloads, where GPU-heavy compute, model endpoints, and connected data stores can quickly drive both cloud spend and security exposure.
Turn cloud sprawl into real savings with Wiz Cloud Cost, backed by ownership, usage, and risk context. See how Wiz helps FinOps, engineering, and security teams investigate spend, prioritize waste, and route fixes to the right owners. Request a live demo of Wiz.
Manage Cloud Costs with Wiz
Learn how Wiz combines security insights with cost visibility to maximize business outcomes.
