


What is Kubernetes monitoring?
Kubernetes monitoring tracks the performance, health, and resource usage of your containerized applications and infrastructure running in Kubernetes clusters. It helps you catch issues early, optimize workloads, and keep your systems reliable.
When you run applications in Kubernetes, you already see how powerful it is for managing containers. But if you don’t monitor it properly, you’ll run into problems—wasted resources, slow performance, or even security risks that could lead to downtime or data loss. Monitoring gives you the visibility you need, from pod-level metrics to overall cluster health, so you can keep everything running smoothly.
Kubernetes monitoring helps you track key metrics across Kubernetes clusters and container environments, from pod-level performance to overall infrastructure health. It enables proactive issue detection, optimizes resource allocation, and strengthens security by identifying anomalies early, ensuring your applications run smoothly and reliably in production.
Kubernetes Security Best Practices Cheat Sheet
Pair your monitoring strategy with proven security practices for Kubernetes clusters.

Key metrics to track in Kubernetes monitoring
To effectively monitor your Kubernetes cluster, track key metrics across different levels: pod and node performance, system and application health, and resource usage. These indicators help you spot issues early, keep workloads efficient, and ensure a seamless user experience.
Running Kubernetes apps smoothly takes more than just setting them up right—it takes ongoing monitoring. If you miss the important metrics, you might overlook performance slowdowns, resource waste, or even full-blown application failures. But when you stay on top of these signals, you can catch problems fast, fine-tune your resources, and keep your cluster healthy and responsive.
Performance metrics
Tracking performance ensures your Kubernetes workloads run efficiently and don’t encounter unexpected slowdowns.
| Monitors pod startup time, restart frequency, and failure rates to identify stability issues | Monitors pod startup time, restart frequency, and failure rates to identify stability issues |
| Measures node availability, CPU and memory usage, and network IO to detect bottlenecks | Measures node availability, CPU and memory usage, and network IO to detect bottlenecks |
Health metrics
Monitoring health metrics helps catch failures before they disrupt your applications.
| Checks the status of key control plane components like the scheduler, controller manager, etc. | Checks the status of key control plane components like the scheduler, controller manager, etc. |
| Monitors service response times, error rates, and transaction volumes to ensure application reliability | Monitors service response times, error rates, and transaction volumes to ensure application reliability |
Resource utilization metrics
Keeping an eye on resource usage prevents overprovisioning, underutilization, and performance issues.
| Metric | What it tells you |
|---|---|
| CPU and memory usage | Monitors CPU load, memory consumption, and potential memory leaks at both the pod and node levels |
| Storage and network usage | Measures disk read/write operations, storage capacity, bandwidth usage, packet loss, and latency |
What are the top challenges of Kubernetes monitoring?
Kubernetes offers flexibility and scalability, but its complexity makes monitoring a challenge. With constantly shifting workloads, distributed components, and real-time scaling, maintaining visibility across your environment requires the right tools and strategies. Here are some of the biggest hurdles:
High data volume: Kubernetes generates massive amounts of metrics and logs, making it difficult to separate useful insights from excess data. The key is filtering out noise to capture relevant signals—such as performance anomalies, resource saturation, or security alerts—that impact system health, reliability, and Kubernetes security.
Complexity of distributed systems: With workloads spread across multiple nodes and clusters, pinpointing performance issues requires a well-structured monitoring strategy.
Resource overhead: Poorly configured monitoring can consume excessive CPU and memory, negatively affecting application performance instead of improving it.
Lack of standardization: Different teams and tools may track different metrics, leading to inconsistencies in how monitoring data is interpreted and acted upon.
Popular Kubernetes monitoring tools
Choosing the right Kubernetes monitoring tool depends on what you need to measure – resource usage, application performance, log data, or end-to-end request traces. Different tools excel in different areas, from metrics collection to observability and visualization. Here’s an overview of widely used Kubernetes monitoring tools (in no particular order) and the core capabilities they offer.
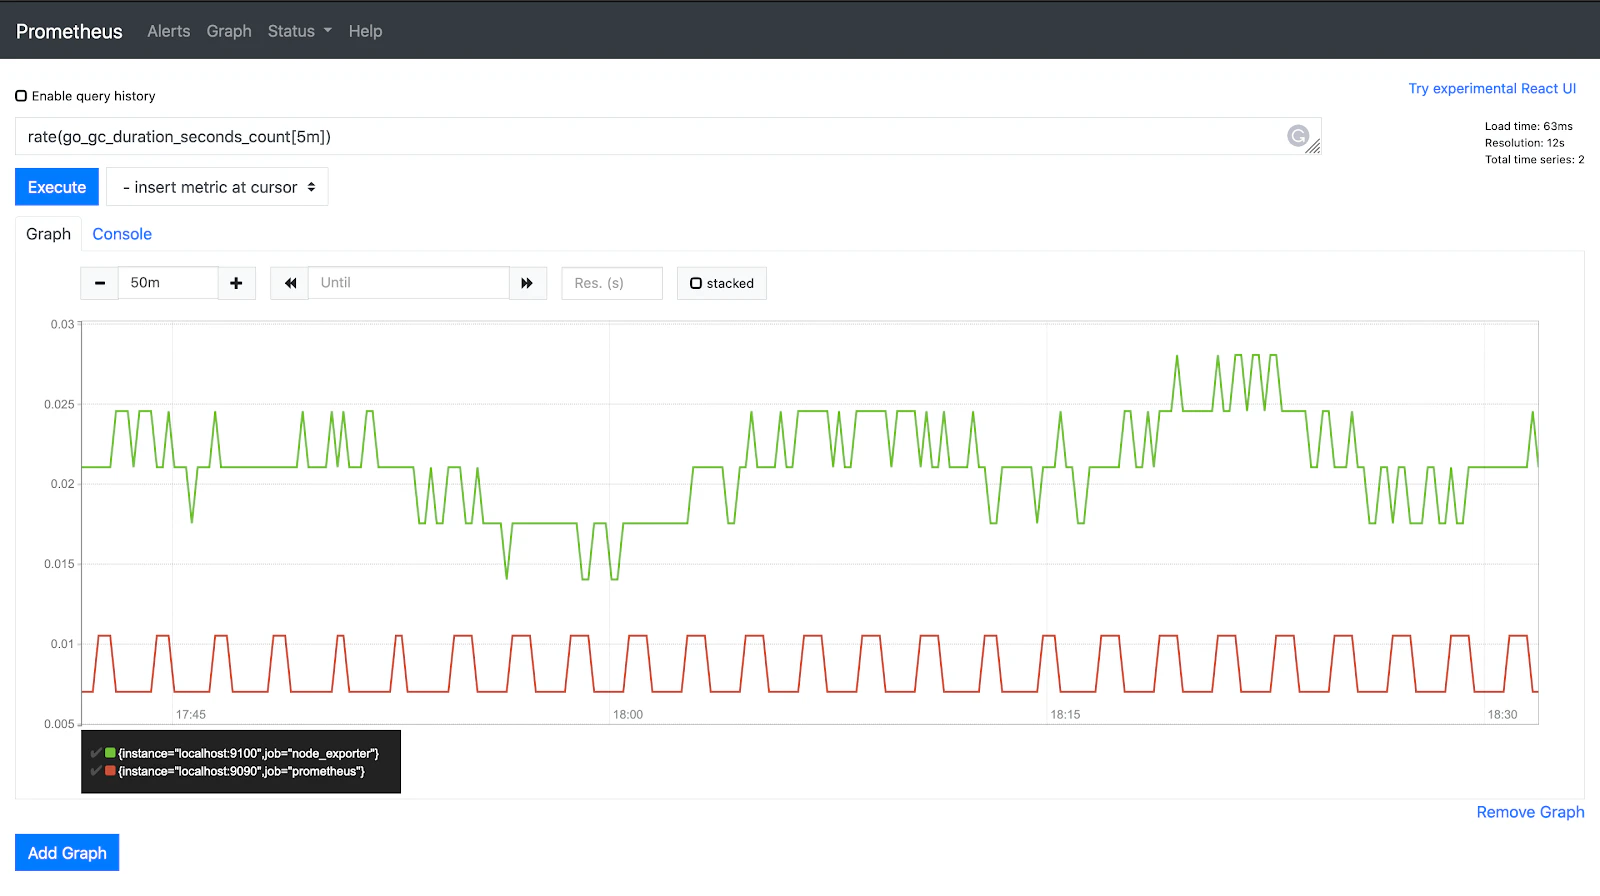
Prometheus
Prometheus is an open-source monitoring tool that makes tracking Kubernetes metrics flexible and scalable. It collects time-series data so you can easily query and analyze performance.
Key features:
Powerful query language (PromQL): PromQL allows users to analyze and extract insights from time-series data efficiently.
Built-in alerting with Alertmanager: Prometheus integrates with Alertmanager to manage and route alerts based on predefined conditions.
Efficient data collection with a pull-based model: Prometheus gathers metrics by pulling data from configured endpoints, reducing overhead on monitored systems.
Native Kubernetes integration: Prometheus works seamlessly with Kubernetes, automatically discovering and monitoring cluster components.
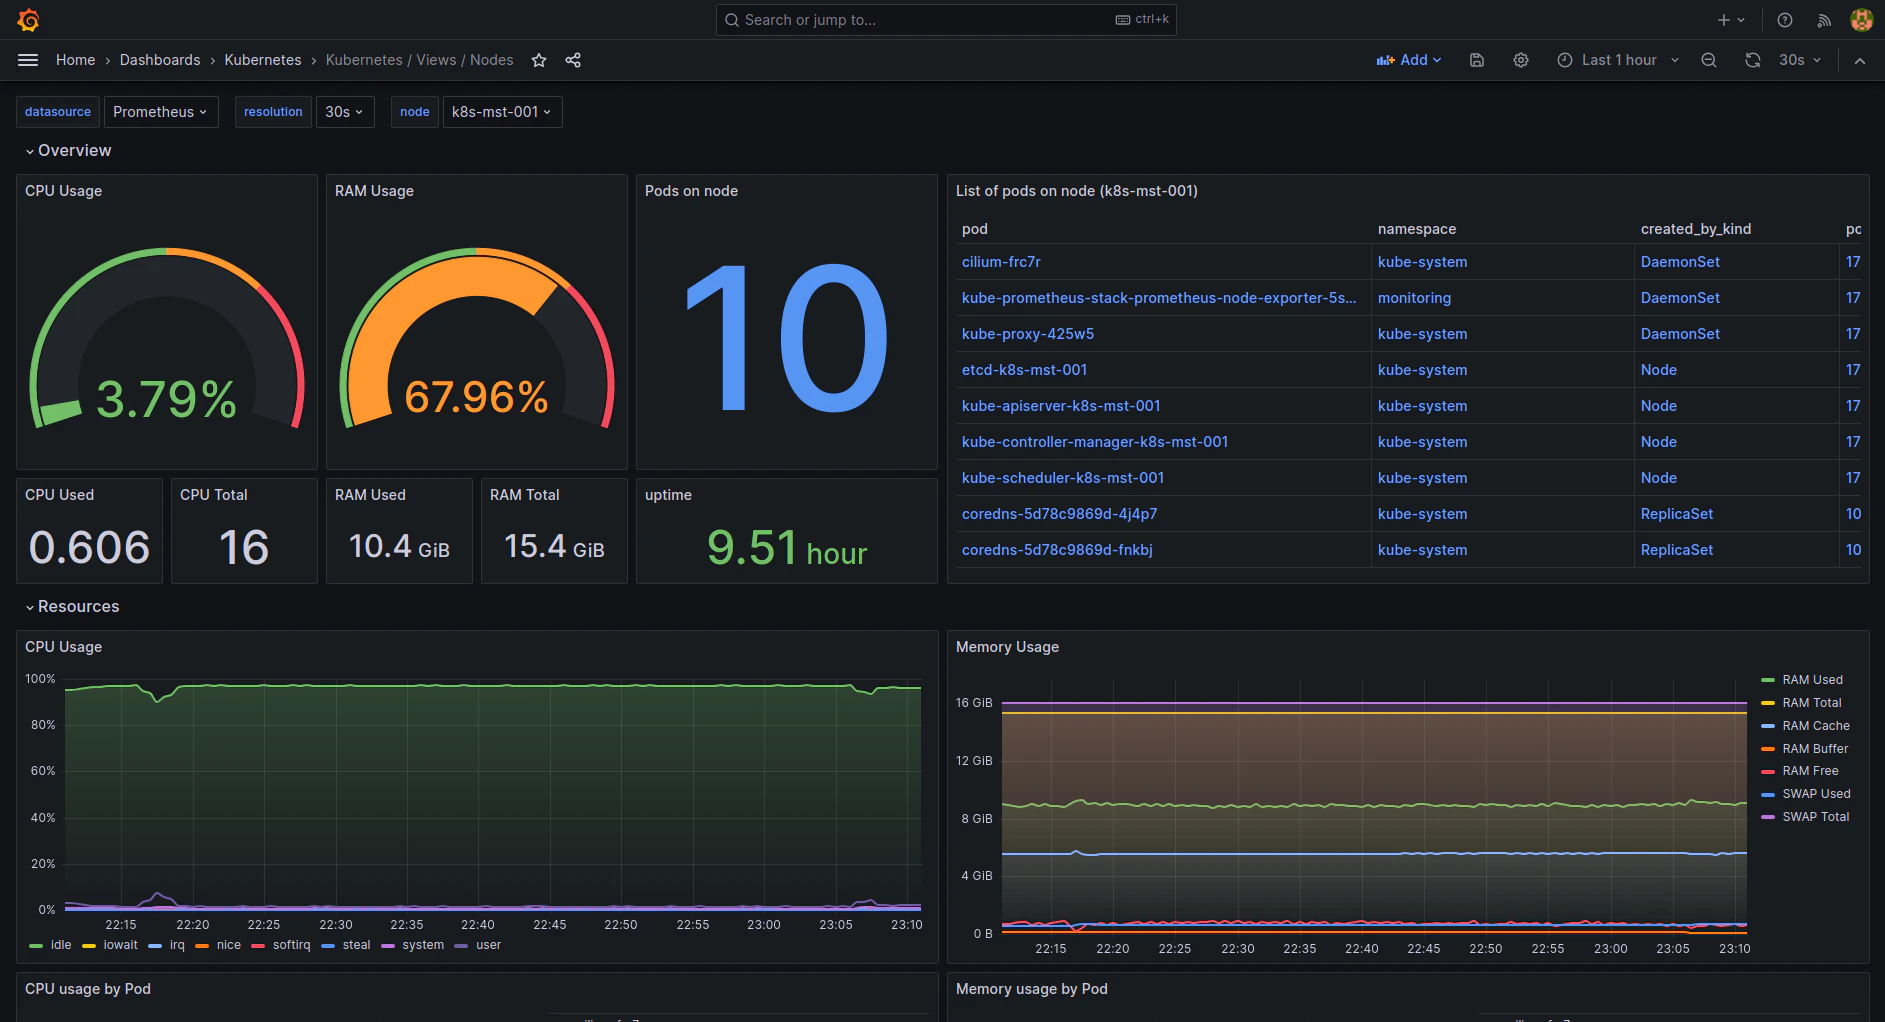
Grafana
Grafana transforms raw data into insightful dashboards, making it an essential companion to Prometheus. It’s widely used for monitoring Kubernetes clusters with customizable, real-time visualizations.
Key features:
Supports multiple data sources: Grafana integrates with various backends, including Prometheus, Elasticsearch, and Loki, allowing you to visualize data from different sources in one place.
Highly customizable dashboards: Users can create and modify dashboards to fit their specific monitoring needs using a wide range of visualization options.
Alerting and notification system: Grafana enables users to set up alerts based on defined thresholds and send notifications through multiple channels like Slack, email, and webhooks.
Elastic Stack
Elastic Stack—comprising Elasticsearch, Logstash, and Kibana—specializes in log aggregation and analysis. It helps teams process and visualize massive amounts of log data from Kubernetes environments.
Key features:
Centralized log storage and analysis: Elastic Stack collects, processes, and stores logs in a unified system, making it easier to analyze and manage large volumes of data.
Scalable and efficient search capabilities: Elasticsearch enables fast and scalable searching, allowing teams to quickly retrieve relevant logs from vast datasets.
Real-time log visualization with Kibana: Kibana provides interactive dashboards and visualizations, helping teams monitor and interpret log data in real time.
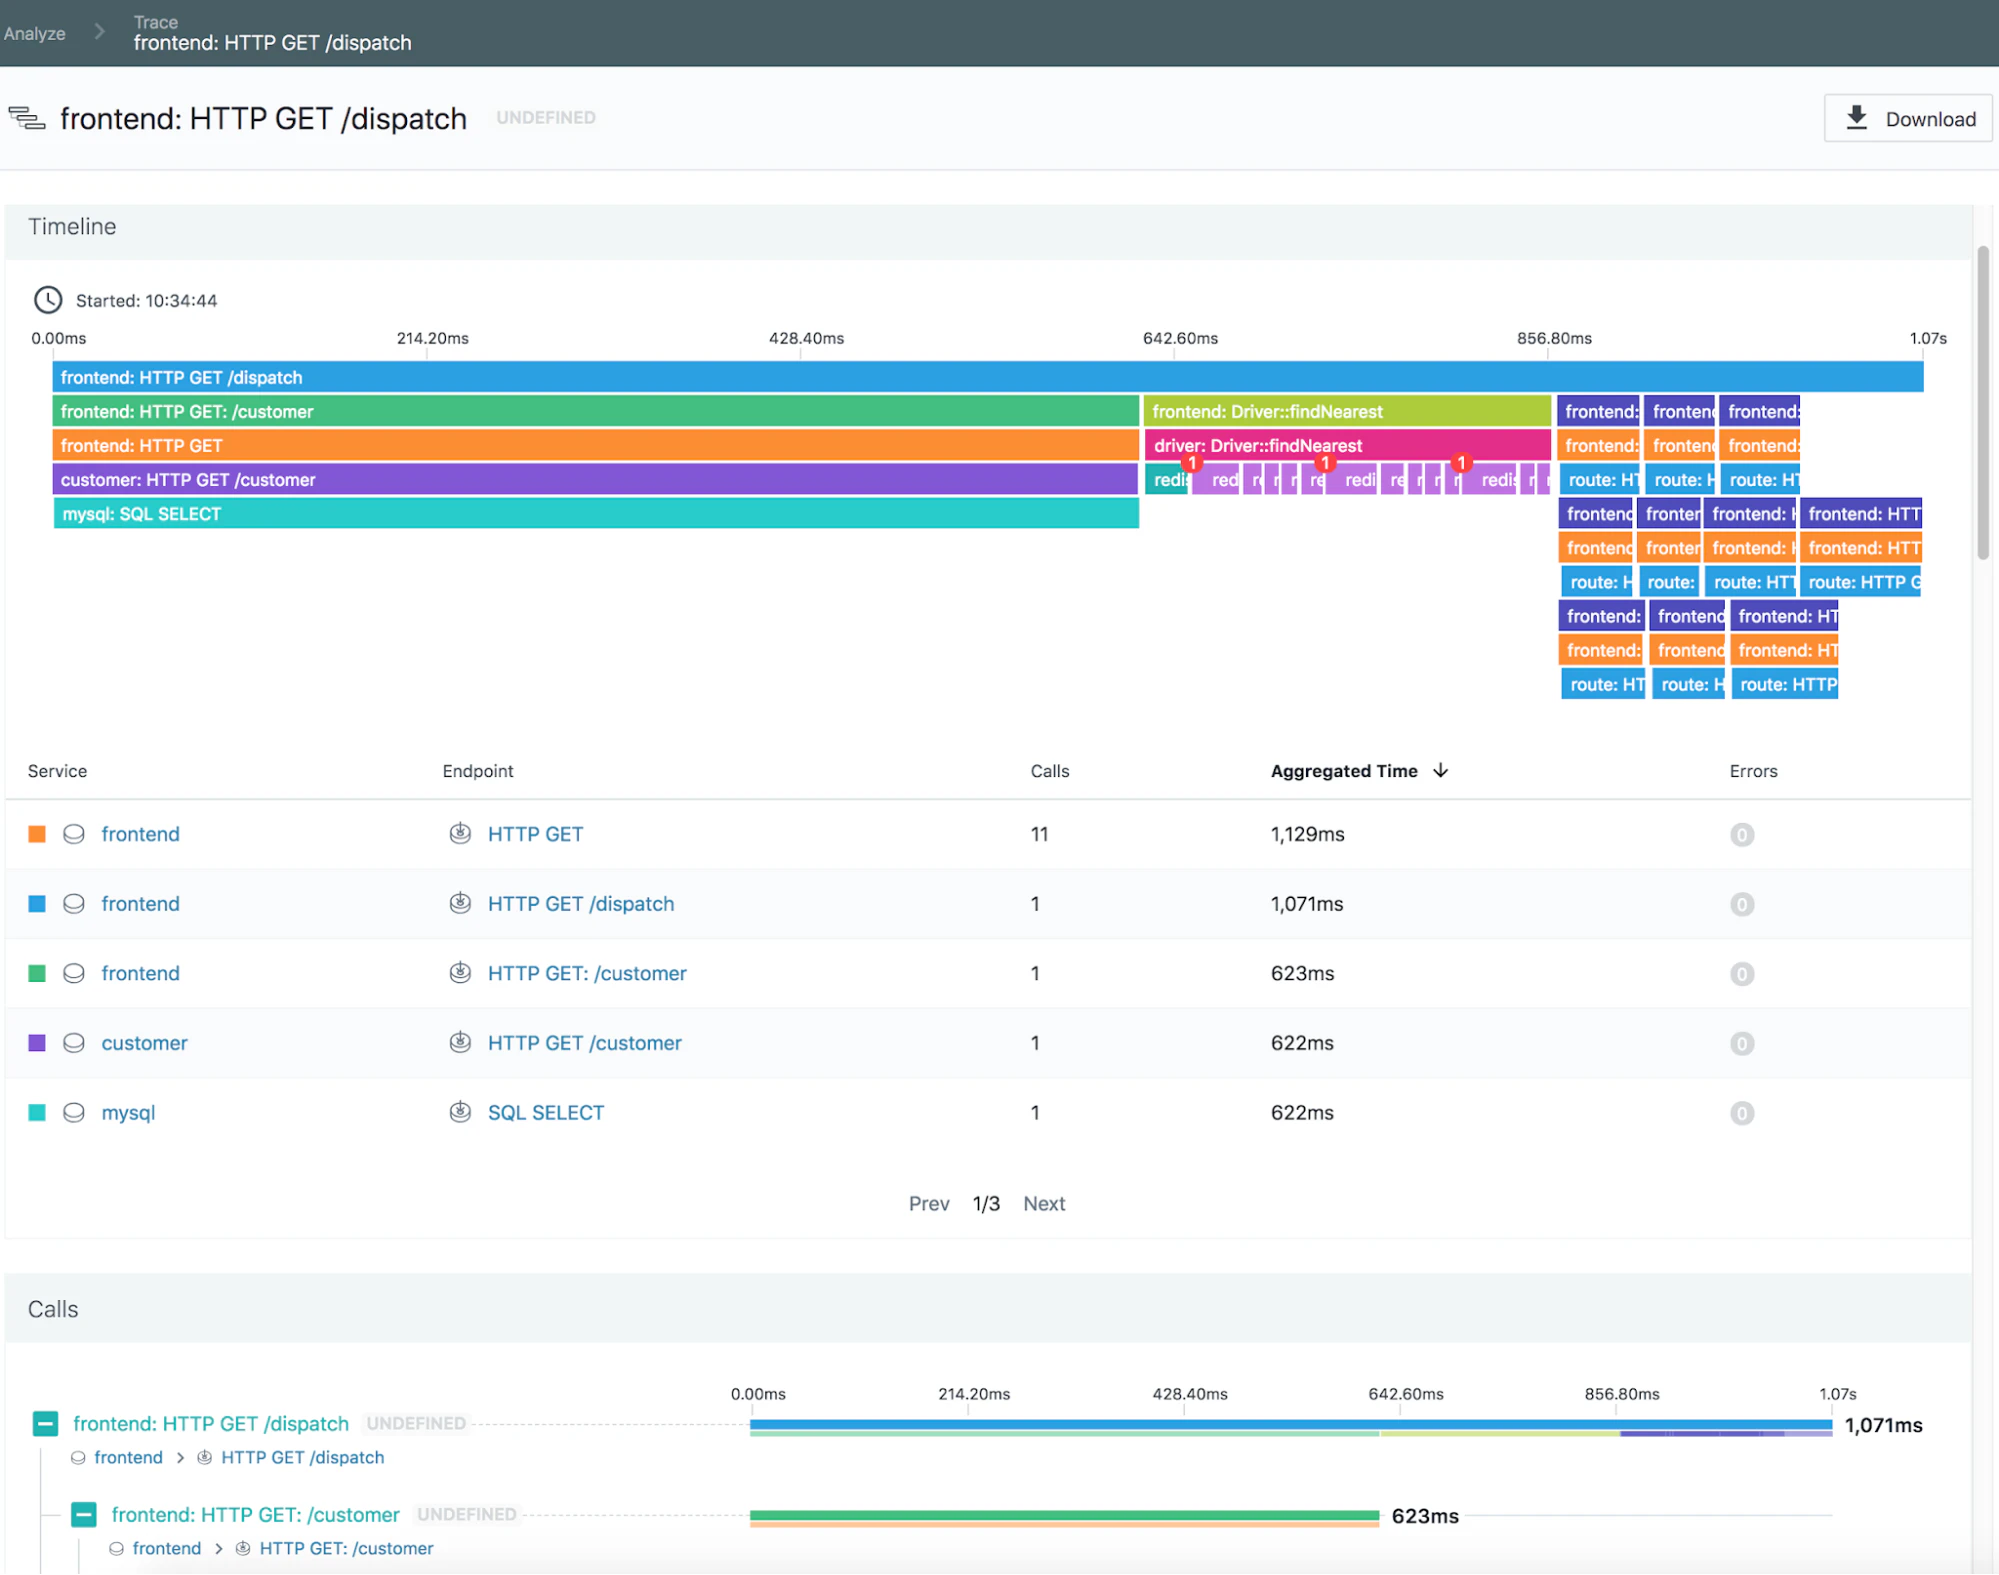
Jaeger
Jaeger focuses on distributed tracing, making it an excellent choice for monitoring microservices-based applications running on Kubernetes. It helps pinpoint latency issues and optimize service performance.
Key features:
End-to-end request tracing: Jaeger tracks requests as they move through different services, providing full visibility into their journey.
Root cause analysis for latency and failures: It helps identify performance bottlenecks and failure points, enabling faster issue resolution.
Native Kubernetes integration: Jaeger seamlessly integrates with Kubernetes, making it easy to deploy and monitor distributed applications.
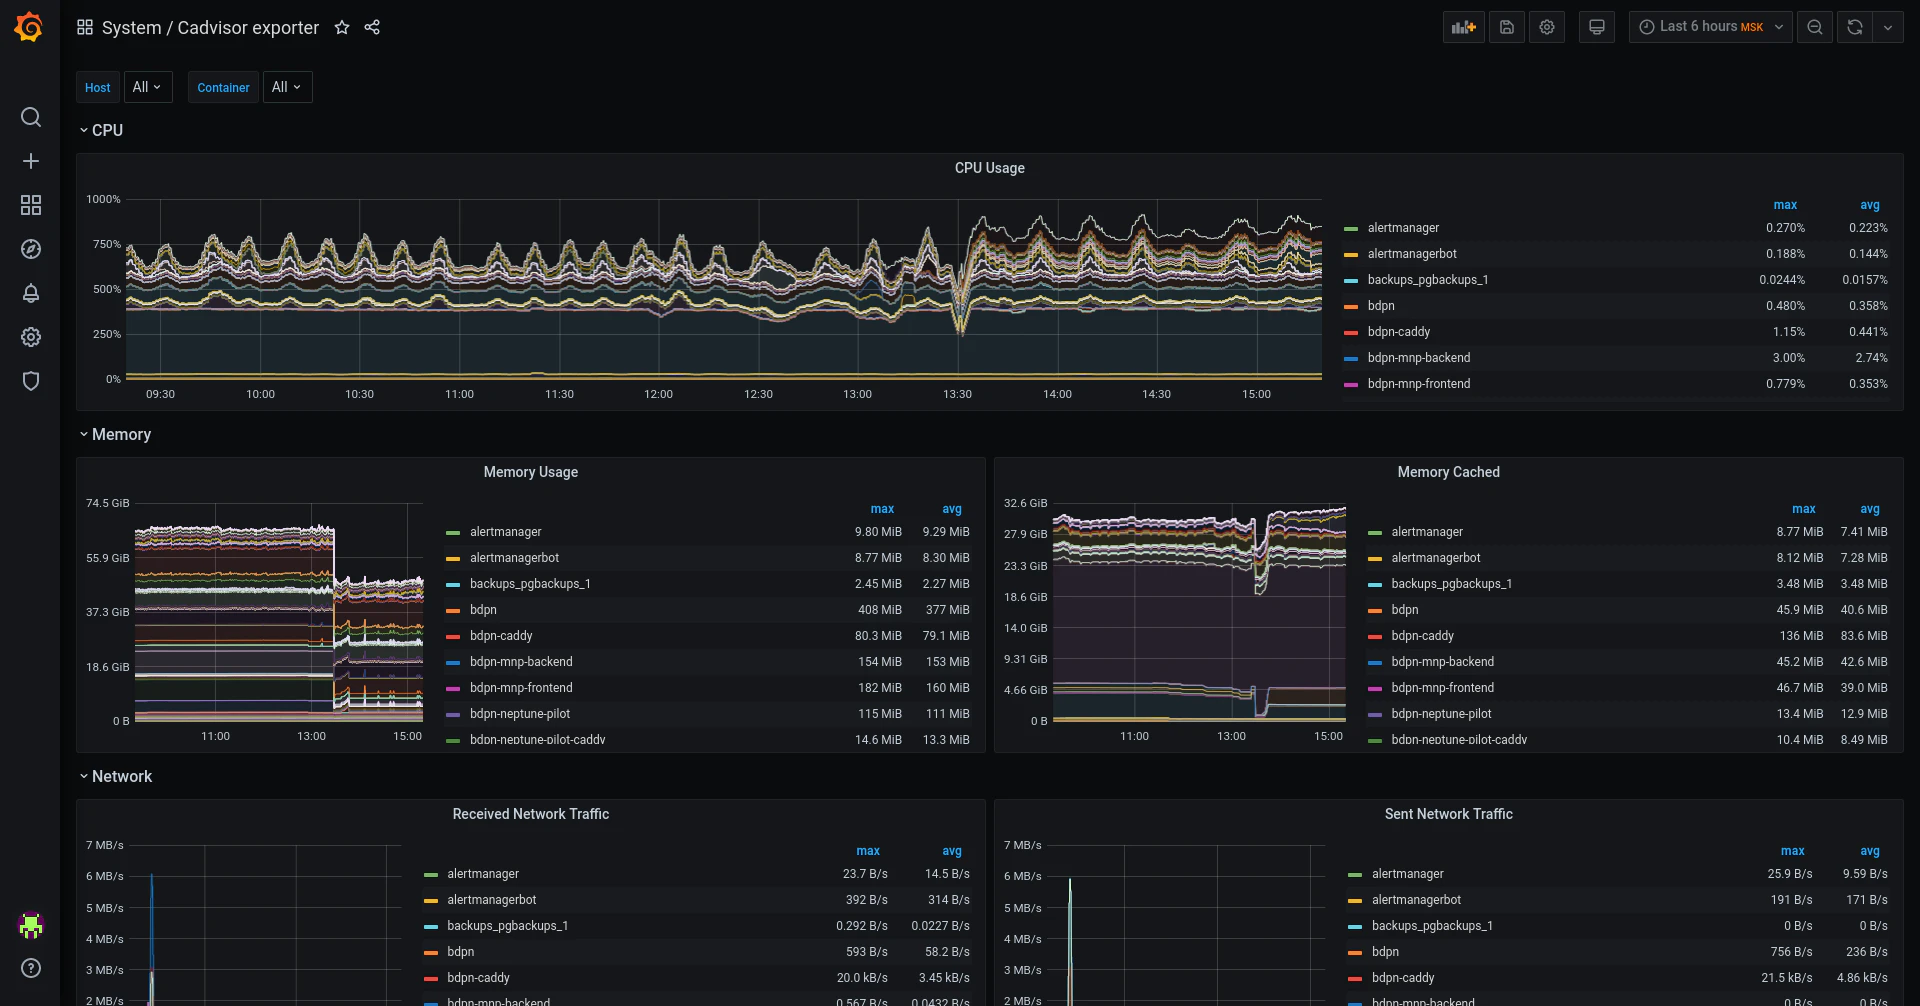
cAdvisor (Container Advisor)
cAdvisor, built by Google, provides real-time monitoring of container resource usage. It runs as part of the kubelet, offering native Kubernetes support for tracking CPU, memory, and disk usage.
Key features:
Lightweight and built into Kubernetes: cAdvisor runs efficiently as part of the kubelet, requiring minimal resources.
Tracks resource consumption at the container level: It provides detailed insights into CPU, memory, and disk usage for individual containers.
No additional setup required: Since cAdvisor is natively integrated, it works out of the box without extra configuration.
Choosing the right Kubernetes monitoring tool
Keeping your Kubernetes clusters healthy requires more than just deploying a monitoring tool –nit’s about choosing one that fits your environment and scales with your needs. The right solution gives you real-time insights, helps prevent downtime, and integrates seamlessly with your existing stack. Here’s what to look for when making your choice.
Real-time monitoring capabilities
Issues in Kubernetes can escalate quickly, so real-time monitoring is essential. A good monitoring tool should collect and analyze data instantly, alerting you before performance degradation affects user experience or resource constraints impact workload efficiency. Look for solutions that offer real-time metrics and proactive notifications to keep your applications running smoothly.
Customization and scalability
No two Kubernetes deployments are the same, so flexibility matters. The best monitoring tools let you customize dashboards and fine-tune metrics based on your specific workload. They should also scale effortlessly, ensuring performance remains consistent as your clusters grow.
Integration with other tools and systems
Kubernetes doesn’t operate in isolation. Your monitoring tool should work well with your entire tech stack, including cloud services, CI/CD pipelines, and incident management platforms. Strong integrations ensure a unified monitoring approach, giving you full visibility across your infrastructure.
Watch 12-min demo
See how Wiz delivers unified visibility across your Kubernetes clusters and cloud infrastructure.

Best practices for Kubernetes monitoring
Effective monitoring keeps your Kubernetes clusters stable, efficient, and responsive. By setting up smart alerts, ensuring high availability, and optimizing resource usage, you can catch issues early and keep your infrastructure running smoothly. To achieve this, focus on the following best practices:
Set up effective alerts and notifications
Alerts should provide actionable insights, not just noise. Start by defining the most critical metrics for your applications – CPU and memory usage, pod crash loops, and error rates are key indicators of system health.
Focus on key metrics: Identify the performance indicators that truly matter for your workloads. Monitoring everything creates unnecessary noise, so prioritize metrics that impact reliability.
Use Prometheus Alertmanager: If you’re using Prometheus, configure Alertmanager to handle alerts efficiently. It can group and route notifications to the right channels, whether that’s email, Slack, or a dedicated system to improve incident response.
Regularly test alerts: Run simulations to ensure alerts trigger at the right thresholds and reach the intended recipients. Misconfigured alerts can cause delays in issue resolution.
Ensure high availability and disaster recovery in monitoring setups
A monitoring system that fails during an outage defeats its purpose. Make sure your setup is resilient and backed up properly.
Deploy monitoring tools in high-availability mode: Running multiple instances of Prometheus across different availability zones or clusters prevents single points of failure. A load balancer helps distribute traffic efficiently.
Automate backups: Regularly back up your monitoring data and configurations. With Prometheus, this means snapshotting its data directory and storing copies in a secure, offsite location.
Optimize resource utilization and cost efficiency
Kubernetes makes scaling easier, but inefficient resource allocation can lead to unnecessary costs. Monitoring usage helps you stay efficient.
Track resource consumption: Use cAdvisor or Prometheus to monitor CPU and memory usage in real time. Set alerts for high consumption to prevent resource contention.
Enforce resource limits: Set and enforce resource requests and limits for Kubernetes pods. This prevents any single application from consuming excessive resources, ensuring fair distribution across workloads.
Do AI-driven monitoring and anomaly detection
Traditional monitoring relies on predefined thresholds, but AI-driven tools take it further by analyzing historical data to detect anomalies before they cause issues. This is where Wiz simplifies security and compliance monitoring, using AI-driven insights to detect risks faster and more accurately.
Use AI for predictive monitoring: AI models analyze past performance trends, helping you predict and prevent potential failures before they happen.
Automate anomaly detection: Tools like Wiz and others continuously learn from system behavior, identifying deviations without requiring manual configuration. This approach is especially useful for detecting Kubernetes anomalies, helping to surface unusual patterns within clusters, reduce response time, and improve system reliability.
Reduce alert fatigue: AI-powered monitoring minimizes false alarms by differentiating between normal fluctuations and real issues, ensuring teams focus on critical incidents.
Use advanced K8s observability techniques
Kubernetes generates a massive amount of data, but traditional monitoring alone isn't enough to capture every detail. Advanced observability techniques provide deeper insights, helping you track dependencies, optimize performance, and respond to issues in real time.
Use distributed tracing for deep visibility: Tools like Jaeger and OpenTelemetry track requests as they move through microservices, helping you identify latency issues.
Leverage service meshes for enhanced monitoring: Istio, Linkerd, and similar tools provide built-in telemetry, allowing you to monitor traffic flows, enforce security policies, and gain granular visibility into service interactions.
Implement event-driven monitoring for real-time response: Instead of waiting for scheduled checks, use event-driven systems like Kubernetes Event-Driven Autoscaling (KEDA) to trigger actions instantly when anomalies occur.
Improve your Kubernetes cluster monitoring, improve your response time
Effective Kubernetes monitoring goes beyond tracking metrics—it ensures stability, security, and peak performance. A strong monitoring strategy helps you detect and resolve issues before they impact your applications. It also optimizes resource usage, improves system reliability, and strengthens security.
By applying these Kubernetes best practices, you’ll gain deeper visibility into your clusters, allowing you to make data-driven decisions and enhance operational efficiency.
How Wiz can help
If you want to elevate your Kubernetes monitoring and security, Wiz provides a unified cloud security platform designed for prevention, detection, and response. Its cloud-native approach enables security, development, and DevOps teams to collaborate seamlessly.
Container and Kubernetes security: Protect your workloads from build to runtime, addressing vulnerabilities proactively.
Comprehensive cloud security: Get a single view of vulnerabilities, misconfigurations, and compliance risks across your cloud environments.
Real-time threat detection: Identify and respond to security threats with deep visibility and actionable insights.
Wiz can do more than enhance Kubernetes monitoring—it strengthens your overall cloud security posture by prioritizing risks and improving response time.Get a demo to see how unified visibility transforms your Kubernetes operations.
There’s more to Kubernetes monitoring than meets the eye. Get the Actionable Kubernetes Security Best Practices [Cheat Sheet] for advanced techniques to secure your Kubernetes architecture.
See Wiz in Action
Experience how Wiz secures Kubernetes workloads from build to runtime with full-stack visibility.
