


Container monitoring collects, analyzes, and reports metrics on the performance and health of containerized applications and their environments. This practice is essential for gaining visibility into container operations, understanding key metrics, and diagnosing performance issues.
Containers provide a lightweight, scalable solution for deploying applications, but their ephemeral nature and dynamic environments create unique challenges.
Let’s dive into what you should monitor to keep containerized applications running smoothly and how you can tackle key obstacles.
Key metrics and aspects to monitor in containers
Effective container monitoring requires tracking these key performance metrics to meet optimal resource usage, network reliability, and application health and catch issues early:
CPU and memory usage: Monitoring CPU and memory consumption helps you identify underutilized containers or those struggling under heavy loads. For example, monitor for high usage (>80%) or memory leaks and scale horizontally with Kubernetes HPA or adjust resource limits.
Network traffic and performance: Tracking traffic volume, latency, and packet loss helps you detect bottlenecks and issues affecting responsiveness and reliability. Your team can detect latency spikes (>100ms) or packet loss (>1%). They can also optimize with gRPC and Kubernetes Network Policies.
Application health and performance: Measuring response times, transaction volumes, and error rates ensures that container applications run efficiently. Start by identifying slow endpoints (>500ms) or high error rates (>5%). Implement circuit breakers and retries.
Log management and analysis: Managing and analyzing logs enables teams to filter noise, identify relevant error messages, and diagnose deeper issues. For example, filter logs for repeated errors and use Fluentd or Loki for aggregation and alerting.
Error rates and exceptions: Monitoring error rates and exceptions helps you detect performance issues or bugs that require immediate attention. Your team can monitor for error spikes (>2%) and automate rollbacks with GitOps tools like ArgoCD.
What is Cloud Security Monitoring? Benefits, Challenges, and Best Practices
En savoir plus

Container monitoring challenges
While container monitoring offers essential benefits, it also brings unique challenges. Here are some obstacles to effective container monitoring and advice for overcoming them:
| Challenge | Description |
|---|---|
| Containerized environments’ dynamic, ephemeral, and scalable nature | Containers have short lifespans, ranging from seconds to days, and dynamically scale to meet demand. This rapid change complicates traditional monitoring, so monitoring solutions must track containers in real time and support service discovery to keep up. To help with this, you can track containers in real time with Prometheus and kube-state-metrics and automate configurations with Helm. |
| Complex multi-container and multi-service application monitoring | Modern applications use multiple interdependent containers that run different services. Issues in one container can impact others, making monitoring complex. These practical solutions provide a holistic view of all containers and services to pinpoint problems. OpenTelemetry or Jaeger can help with distributed tracing across services. |
| Integration with existing monitoring systems | Organizations often use existing monitoring tools, which makes integration essential but challenging. However, implementing middleware or adapter services can bridge the gaps to ensure seamless data flow and a unified view of application and infrastructure health. Using Fluent Bit or adapters can help you integrate container metrics into existing systems like Splunk. |
| Comprehensive coverage without information overload | Containerized applications generate vast amounts of data, which increases the risk of information overload. Because of this, monitoring solutions must balance extensive coverage with filtering noise. Intelligent alerting and customizable dashboards can help you highlight critical insights without alert fatigue. Prometheus Alertmanager, for example, is great for grouped alerts, while Grafana allows you to customize dashboards for key metrics. |
Container Security Best Practices [Cheat Sheet]
What's included in this 9 page cheat sheet? 1. Actionable best practices w/ code examples + diagrams 2. List of the top open-source tools for each best practice 3. Environment-specific best practices

Popular container monitoring tools
Container monitoring provides visibility into performance, availability, and security across containerized applications. The following tools are widely adopted in modern environments and contribute to building reliable, well-observed cloud systems.
Prometheus
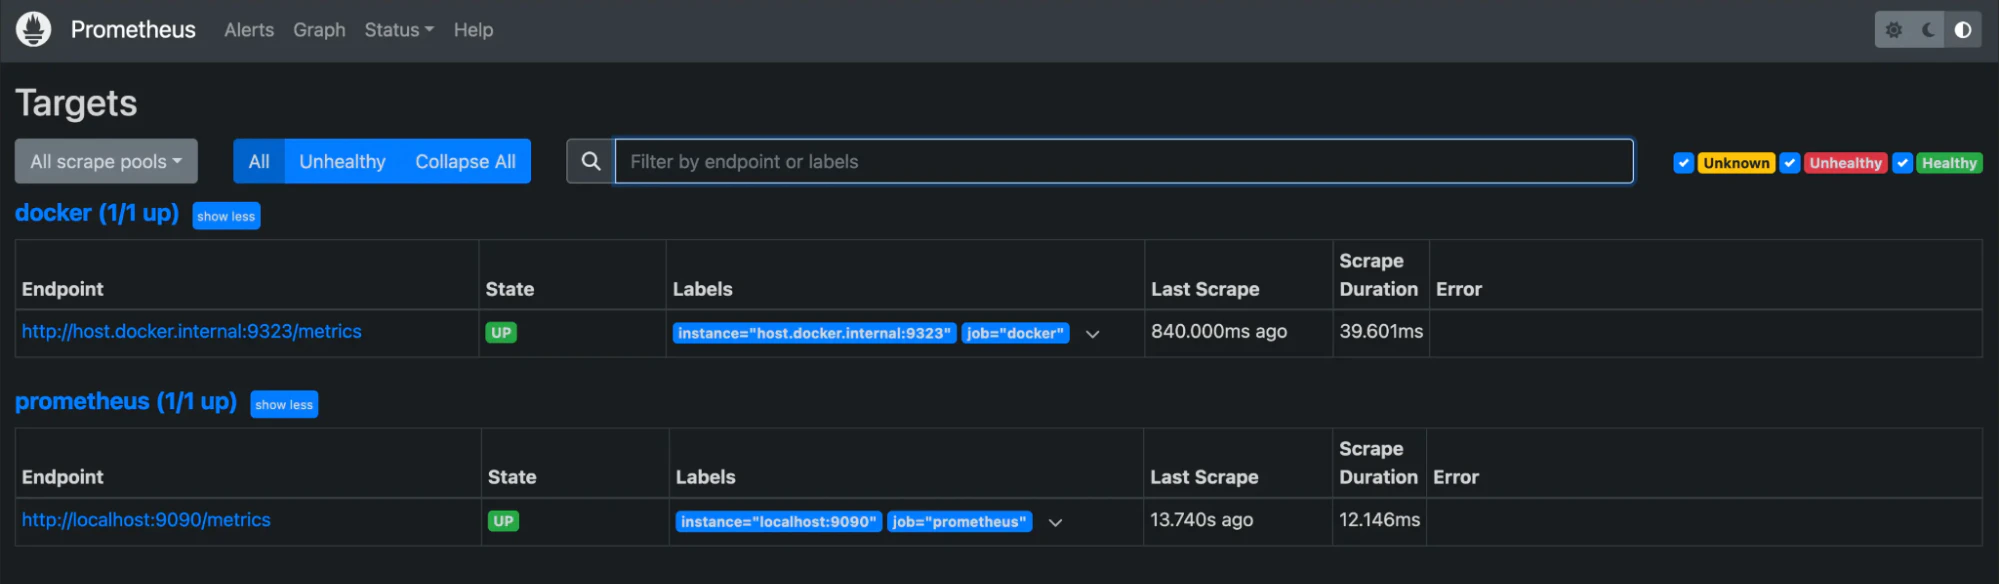
Prometheus is an open-source monitoring and alerting toolkit designed for dynamic, container-based systems. It collects and stores time-series data, providing teams with real-time insights into workload performance and resource usage. Prometheus integrates natively with Kubernetes and other orchestration platforms for automated discovery and consistent metric collection.
Key features:
Multidimensional data model for storing time series data enriched with metadata
Flexible query language (PromQL) for retrieving and analyzing metrics
Support for service discovery or static configuration to discover targets
Integrated alerting based on custom-defined conditions
Grafana
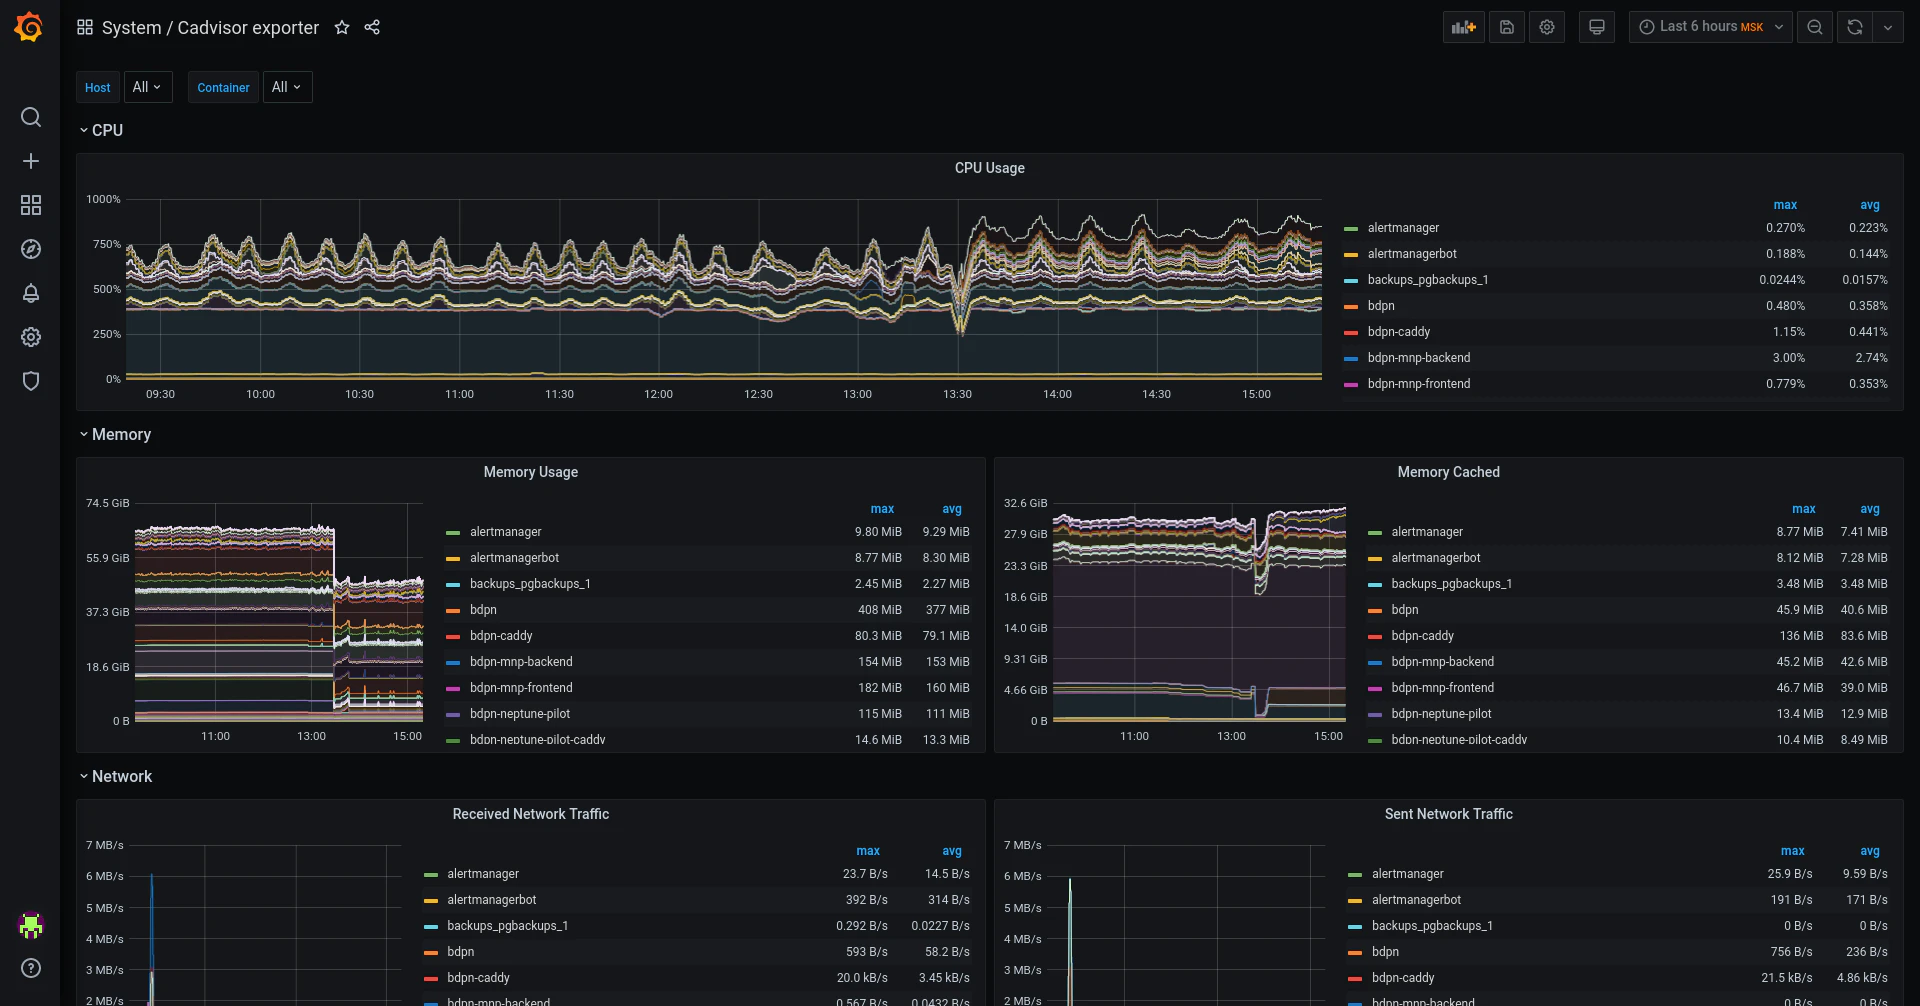
Grafana provides flexible data visualization for monitoring and observability. It helps teams create interactive dashboards that display real-time metrics from multiple data sources, offering a unified operational view. Grafana integrates easily with Prometheus, Datadog, and other monitoring systems to support collaborative, data-driven decision-making.
Key features:
Rich visualization options with customizable dashboards
Integrations with various data sources, such as Prometheus and Datadog
Advanced alerting and notification capabilities
Friendly user experience and interface with an easy setup
Datadog
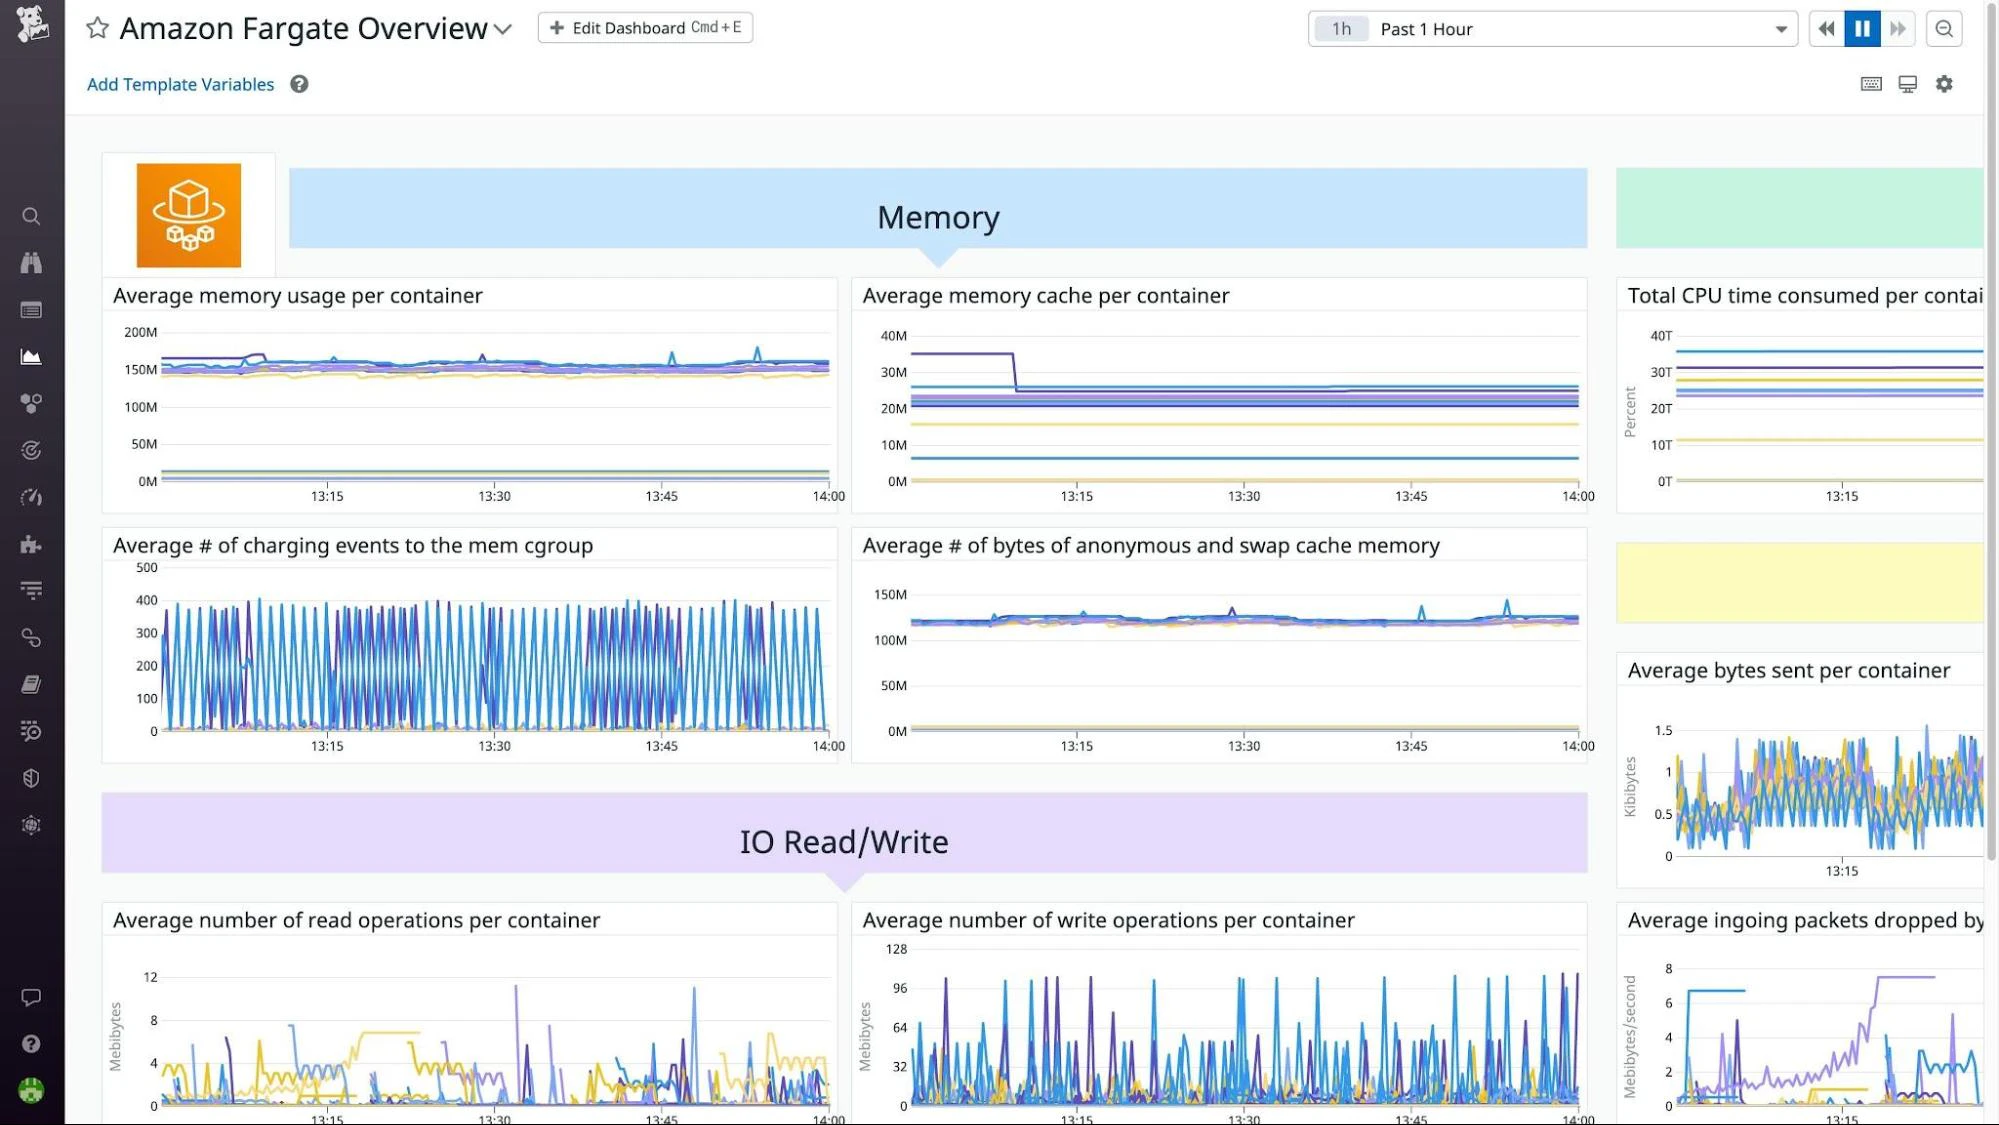
Datadog offers unified observability across infrastructure, applications, and containers. It collects metrics, traces, and logs to help teams monitor performance, detect anomalies, and understand dependencies within distributed systems. Datadog’s integrations span cloud services, orchestration platforms, and CI/CD pipelines for end-to-end visibility.
Key features:
Real-time performance monitoring with detailed dashboards
Seamless integrations with over 400 technologies, including container ecosystems
Advanced analytics and machine learning for anomaly detection
Log management and analysis integration with monitoring for comprehensive insights
Container Security Buyer's Guide
In this guide, we’ll talk about what’s driving the adoption of cloud-native application development, why it can increase risk, and why container security is needed to close the security gaps it can introduce.
Get Guide
How to choose the right tool for your needs
The selection of a container monitoring tool often depends on an organization’s operational model, infrastructure scale, and existing observability stack. The following factors are commonly evaluated during the selection process:
Integration capabilities: Choose a tool that integrates seamlessly with your infrastructure and monitoring systems.
Scalability: Ensure that it scales with your applications and handles dynamic container deployments.
Feature set: Look for real-time monitoring, service discovery, alerting, and visualization to meet your needs.
Ease of use: Assess the learning curve and implementation effort, especially for teams that are new to container monitoring.
Effective container monitoring best practices
Successful container monitoring helps you maintain your containerized applications' health, security, and performance. When implementing monitoring strategies, you can proactively find and remediate issues before they impact users.
Below are three best practices you can utilize for improved container performance and monitoring today:
1. Implementing centralized logging
Centralized logging pulls logs from all containers into one searchable hub, which makes troubleshooting easier and streamlines application analysis and security investigations.
Actionable tips to get started:
Identify a logging driver: Pick a logging driver that works well with your container runtime, like Docker or containerd.
Leverage a log aggregator: Use an aggregator like Grafana, Fluentd, or Fluent Bit to collect, process, and send logs to your central location.
Centralize your storage: Store logs in a centralized and searchable repository with a cloud-based logging tool.
What this looks like:
For Docker, you can configure the Fluentd logging driver like this:
{
  "log-driver": "fluentd",
  "log-opts": {
    "fluentd-address": "localhost:24224",
    "tag": "docker.{{.Name}}"
  }
}
For this example, deploy Fluentd or Fluent Bit as a DaemonSet in Kubernetes to collect logs from all pods. Also, send logs to Elasticsearch, Grafana Loki, or a cloud-native tool like AWS CloudWatch Logs for centralized storage and searchability.
2. Setting thresholds and alerts
You can proactively identify security issues when you add thresholds for key performance indicators and configure alerts. This approach helps your team respond more quickly to performance degradations, threats, and anomalies.
Actionable tips to get started:
Establish key metrics: Decide on the metrics that best show your container's health, performance, and security, such as CPU, network, response times, error rates, and memory.
Clarify your baseline metrics: Find out what numbers work for your container environment and create only essential alerts so your team doesn’t get alert fatigue. Be sure to also set realistic goals.
What this looks like:
To alert when CPU usage exceeds 80% for more than five minutes, configure Prometheus with the following rule:
groups:
  - name: container-resources
    rules:
      - alert: HighContainerCPUUsage
        expr: rate(container_cpu_usage_seconds_total[5m]) > 0.8
        for: 5m
        labels:
          severity: warning
        annotations:
          summary: "High CPU usage detected"
          description: "Container {{ $labels.container }} exceeded 80% CPU usage for 5 minutes."
You can also use Prometheus Alertmanager to send grouped notifications via Slack, PagerDuty, or email for timely awareness and action.
3. Regularly updating monitoring configurations
By regulating audit and review monitoring configurations, you can ensure that these processes protect the current state of the environment and continue to provide relevant insights.
Actionable tips to get started:
Automate your configuration management: Adopt configuration management tools like Ansible and Puppet to automate your config updates.
Regularly review: Implement and schedule consistent reviews to verify your configurations.
Leverage version control: Store your configurations in a version control solution like Git so you can track your changes and collaborate with your DevOps team.
What this looks like:
An example like the following shows how you could automate configuration with Ansible:
# ansible-playbook automated_config_management.yml

- name: Automated Configuration Management
  hosts: all
  become: yes

  vars:
    config_path: /etc/audit
    rule_file: /etc/audit/rules.d/audit.rules

  tasks:
    - name: Ensure configuration management packages are installed
      package:
        name:
          - auditd
          - audispd-plugins
        state: present

    - name: Configure audit rules
      copy:
        content: |
          # File managed by Ansible - manual changes will be overwritten
          -w {{ config_path }} -p wa -k config_changes
          -w /etc/systemd -p wa -k service_changes
          -w /etc/passwd -p wa -k user_changes
          -w /etc/group -p wa -k group_changes
        dest: "{{ rule_file }}"
        owner: root
        group: root
        mode: '0640'
      notify: restart auditd

    - name: Ensure auditd service is enabled and running
      service:
        name: auditd
        state: started
        enabled: yes

  handlers:
    - name: restart auditd
      service:
        name: auditd
        state: restarted
The benefits of container monitoring
Implementing monitoring in development and operational workflows boosts containerized application performance, reliability, and security. Here’s a closer look at these advantages:
Improved application performance and reliability: Continuously tracking key metrics helps teams identify and fix issues before they impact users. Monitoring CPU usage in Prometheus might reveal a container consistently exceeding utilization. Teams can use Kubernetes HPA to scale pods dynamically, ensuring stable application performance during traffic spikes.
Faster issue detection and resolution: Real-time monitoring and intelligent alerts speed up issue identification and resolution. You can configure Prometheus Alertmanager to notify your team via Slack when memory usage exceeds 80% for more than five minutes. This early warning system allows teams to resolve resource bottlenecks before they cause downtime.
Enhanced security and compliance: Adopting container best practices like monitoring access logs, network traffic, and anomalies helps you detect security threats early. This oversight also ensures compliance with industry regulations and security standards. You can use Fluentd to collect logs from all containers and send them to Elasticsearch for centralized analysis. This setup allows security teams to identify unauthorized access attempts in real time, meeting compliance requirements like PCI DSS or HIPAA.

Wiz: Enhance your container security
Wiz is a leading platform that secures everything you build and run in the cloud, including containerized applications. But beyond monitoring performance and health, it also enhances container security with prevention, detection, and response capabilities that are essential for modern development and operations.
Below are Wiz’s top container features:
Container and Kubernetes security: Wiz secures containers, Kubernetes, and cloud environments from build-time to real-time, enabling teams to develop containerized applications securely while addressing threats throughout the application lifecycle.
Vulnerability management: The Wiz platform uncovers vulnerabilities across clouds and workloads—including VMs, serverless functions, containers, and appliances—without agents or external scans. Its agentless approach streamlines vulnerability detection and mitigation in containerized applications.
Comprehensive cloud security: The solution goes beyond containers with security tools like cloud workload protection, cloud security posture management, and cloud infrastructure entitlement management, which offer a full view of cloud security from configuration auditing to identity access management.
Continuous monitoring and compliance: Wiz monitors cloud environments for sensitive data exposure, misconfigurations, and compliance violations. Its automated compliance with industry and custom standards—such as PCI, GDPR, and HIPAA—also ensures that containerized applications meet regulatory requirements.
Secured container images: WizOS provides a stable, secure base that helps reduce supply chain and base-image vulnerabilities.
You can count on Wiz to help you build and run secure, compliant, and resilient cloud applications. Additionally, WizOS provides minimal, continuously maintained container images, giving teams a trusted foundation to start secure and stay secure. Request a demo today to find out how you can protect your containers and cloud infrastructure.