

Core incident response metrics for security teams
Incident response metrics are critical for understanding how efficiently your security team can identify, respond to, and recover from threats in cloud-native environments. By tracking a comprehensive set of metrics – including speed-based KPIs, incident volumes, closure rates, and quality indicators – you gain a clear view of where your team is excelling and where operational gaps or bottlenecks exist.
This section covers the eight foundational metrics every security team should monitor: Mean Time to Detect (MTTD), Mean Time to Acknowledge (MTTA), Mean Time to Contain (MTTC), Mean Time to Recover (MTTR), incident volume by severity, incident closure rate, reopen rate, and Mean Time Between Incidents (MTBI). Together, they provide a holistic view of your incident response maturity and surface actionable insights for continuous improvement.
Detect active cloud threats
Learn how Wiz Defend detects active threats using runtime signals and cloud context—so you can respond faster and with precision.

1. Mean Time to Detect (MTTD)
Mean Time to Detect (MTTD) measures how quickly your team can identify that a security event is occurring. It’s the average time between when a threat first appears in your environment and when your team detects it. A lower MTTD means you’re catching incidents before they have time to escalate – critical in fast-moving cloud environments where attackers can move quickly. High MTTD usually points to visibility gaps, ineffective alerting, or delayed detection logic.
How to measure it:
MTTD = sum(detection_time − incident_start_time) ÷ number_of_incidentsImprove MTTD by expanding your telemetry coverage, enhancing detection logic, and ensuring your monitoring tools are tuned for cloud-native attack patterns.
2. Mean Time to Acknowledge (MTTA)
Mean Time to Acknowledge (MTTA) tells you how fast your team sees and responds to a new alert. It’s the average time between when an alert shows up and when someone on your team actually acknowledges it – whether by moving a ticket, clicking “acknowledge” in the console, or taking another agreed-upon action. When MTTA is low, it means your alerting is getting to the right people, fast. When it’s high, it often points to alert fatigue, notification overload, or unclear responsibilities. In the cloud, where organizations often face thousands of alerts per real incident, keeping MTTA low is essential for catching real threats before they escalate.
How to measure it:
MTTA = sum(first_ack_time − alert_time) ÷ number_of_alertsDefine what counts as “acknowledged” up front – then stick with it. You can improve MTTA by tuning alert routing, reducing noisy false positives, and making sure your on-call rotations are clear.
3. Mean Time to Contain (MTTC)
Mean Time to Contain (MTTC) is about how quickly you can put a lid on an incident after you’ve detected it. This is the time it takes to isolate affected resources, revoke compromised access, or otherwise stop attackers from spreading or causing more harm. In the cloud, where attackers can pivot across services in minutes (lateral movement), every second counts. A lower MTTC means your containment playbooks and automation are working – and you’re limiting the blast radius before attackers get comfortable.
How to measure it:
MTTC = sum(containment_time − detection_time) ÷ number_of_incidentsWrite clear, repeatable containment steps for different incident types and automate what you can. Use attack path analysis to identify high-risk routes and close them off faster.
4. Mean Time to Recover (MTTR)
Mean Time to Recover (MTTR) – also known as Mean Time to Restore in some contexts – answers the big question: how long does it take to get back to normal after an incident? It’s the average time from when you contain the threat (or the outage starts) to when you’ve fully restored operations. MTTR reflects both your ability to bring systems back online quickly and your ability to fix the root cause so the problem doesn’t come back. The faster your MTTR, the less disruption your business and customers experience.
How to measure it:
MTTR = sum(recovery_time − containment_or_outage_start) ÷ number_of_incidentsIt’s useful to track both “temporary restore” (when the service is back up) and “permanent fix” (when you’ve addressed the root cause). This gives you insight into where your recovery process shines – and where it gets stuck.
5. Incident Volume by Severity
Incident Volume by Severity helps you understand not just how many incidents you’re facing, but how serious they are. You track the number of incidents by severity level (critical, high, medium, low) over time. This shows if your attack surface is expanding, which kinds of incidents are trending up, and where you need to focus resources. Segmenting by severity ensures you’re not treating every alert the same – and helps you prioritize the most urgent threats.
How to measure it: Count incidents at each severity level over consistent periods (weekly, monthly, quarterly). Set Service Level Objectives (SLOs) by severity to define your team’s response targets:
P1 (Critical): MTTA ≤ 5 min, MTTC ≤ 30 min, MTTR ≤ 4 hrs
P2 (High): MTTA ≤ 15 min, MTTC ≤ 2 hrs, MTTR ≤ 12 hrs
P3 (Medium): MTTA ≤ 1 hr, MTTC ≤ 8 hrs, MTTR ≤ 24 hrs
Adjust thresholds for your organization’s risk appetite and business needs.
6. Incident Closure Rate
Incident Closure Rate shows how efficiently your team resolves incidents. It measures the percentage of incidents closed within your defined Service Level Agreements (SLAs). If this number is low, it usually means backlog, bottlenecks, or process issues. Consistently missing closure targets may signal you need more resources, better processes, or more realistic SLAs.
How to measure it:
Incident closure rate = incidents_closed_within_SLA ÷ total_incidentsBreak down closure rates by severity so you can see if critical incidents are getting the attention they need.
7. Reopen Rate
Reopen Rate tells you how often incidents come back after you’ve marked them as “done.” A high reopen rate means issues are getting closed too soon, the fixes aren’t sticking, or the root cause wasn’t found in the first place. This is a quality check for your incident response process – and a red flag for recurring problems.
How to measure it:
Reopen rate = incidents_reopened ÷ incidents_closed (same period)Track how quickly incidents are reopened and look for patterns. Use post-incident reviews to dig into why issues resurface and how to prevent repeat offenders.
8. Mean Time Between Incidents (MTBI)
Mean Time Between Incidents (MTBI) lets you see how much breathing room you have between significant or high-severity security events. Tracking MTBI for major incidents (e.g., P1 and P2) gives a more realistic view of overall stability than including low-severity tickets. A longer MTBI means your environment is more stable and secure – and that your improvements are working.
How to measure it:
MTBI = total_operating_time ÷ number_of_incidentsIf MTBI is shrinking, it could mean threat activity is on the rise or your controls are slipping. To round out the picture, track supporting metrics like:
First-Time-Fix Rate: % of incidents resolved without reopening
% of incidents with Root Cause Analysis (RCA) completed
% of incidents with code-level fixes (not just temporary workarounds)
Cloud Incident Response Plan Template
Looking for a practical incident response plan? Stay tuned – template coming soon!

Cloud-native incident response metrics
Cloud environments introduce unique threats and complexities that traditional incident response metrics can’t fully capture. To get a true sense of your cloud security posture, it’s important to track specialized metrics that highlight automation effectiveness, visibility gaps, and how your team responds to cloud-specific risks.
Let’s break down the key cloud-native metrics you should be watching – and what they tell you about your security maturity.
Automation vs. Manual Response
In the cloud, speed is everything. The more you can automate, the faster you can contain threats before they spread. But not every incident can be handled by a script – sometimes you need humans to step in. Here’s how to measure both sides:
Automated Response Rate: What percentage of incidents are handled end-to-end without any human touch?
Playbook Success Rate: How often do your automated playbooks actually work as intended? Correlate with context like attack paths and resource relationships to keep manual escalations low.
Manual Escalation Rate: How often do incidents require hands-on intervention because automation falls short?
Many teams measure these automation metrics through their SOAR platforms or event-driven response pipelines (like AWS Lambda, Azure Logic Apps, or Google Cloud Functions). Tracking playbook trigger latency – the time between event detection and automation start – can further help optimize automation efficiency.
Detection Coverage Gaps
Blind spots are a cloud security team’s worst enemy. With resources spinning up and down across accounts and regions, it’s easy to lose track. Agentless, API-based discovery helps you see everything – especially short-lived or newly created assets that agents might miss. Here’s what to track:
Detection Coverage: What percentage of your in-scope cloud resources have the right telemetry Measure by account and region for full context, and distinguish between control coverage (logging configured) and signal coverage (data actually used for detection).
Blind Spot Incidents: How many incidents are detected in areas that should have been monitored but weren’t?
Time to Instrument: How quickly are you able to deploy monitoring on new assets after they’re created?
Drill down further with KPIs like:
% AWS accounts with org-level CloudTrail
% AWS accounts running GuardDuty
% critical AWS services logging data events
% EKS clusters with audit logs
% VPCs with Flow Logs
% container registries with image scanning enforced
Segment by provider, region, and landing zone to pinpoint where you need to shore up coverage.
Policy and Misconfiguration Violations
Cloud misconfigurations and policy drift are a leading cause of breaches. To stay ahead, track:
Policy Violation Rate: How often are new deployments breaking your security rules?
Drift Incidents: When do configurations slip away from secure baselines, and how often does this lead to real incidents?
Unaddressed Misconfigurations: What percentage of known issues are still lingering, waiting to be exploited?
API and Application Layer Metrics
APIs are the backbone of cloud-native apps, but they’re also a favorite target for attackers. With code-to-cloud traceability, you can tie API threats directly to the developers who own them – enabling faster fixes and preventing repeat issues. Here’s what you should watch:
% API endpoints authenticated
% endpoints following least-privilege best practices
Endpoints drifting from your OpenAPI spec
Zombie or shadow APIs (not in your official inventory)
Anomalous API call patterns, privilege escalation attempts, deprecated API exploits
Drill deeper with:
Anomalous API Calls: Are there unusual or unauthorized requests hitting your APIs?
Abnormal Identity Usage: Any signs of token misuse or unexpected privilege escalation?
Deprecated API Exploits: Are attackers targeting outdated or unsupported endpoints?
Blast Radius and Impact Metrics
Not all incidents are created equal. Understanding the true impact – both technical and business – is key to prioritizing response and improving controls. Metrics to track include:
Number of affected identities, resources, or accounts
Spread across accounts or regions
Privileged roles accessed
Volume of data exfiltrated
Estimated cost of downtime
Zoom in on:
Affected Resources: How many services, containers, or accounts were impacted?
Lateral Spread: How far did attackers move inside your environment?
Data Exfiltration Volume: How much data was actually taken?
Many organizations also quantify Affected Business Services, which maps technical impact (resources, data, downtime) to customer-facing or revenue-critical systems. This bridges IR metrics to executive-level business risk reporting.
MITRE ATT&CK Coverage
Mapping your detections to the MITRE ATT&CK Cloud Matrix helps you see where you’re strong, and where gaps remain. Track:
% of relevant ATT&CK techniques covered by at least one detection
Detections per technique (for example, 80% of Initial Access, 60% of Privilege Escalation)
Trends in incident volume mapped to ATT&CK tactics
A Practical Guide to Cloud Threat Detection
Ready to level up your cloud detection and response? Get practical, hands-on advice for building a robust cloud security program with our step-by-step guide.

How Wiz makes it easier to measure incident response
Wiz streamlines incident response measurement by giving you unified, automated visibility across your entire cloud – no heavy lifting required. With built-in dashboards, granular timelines, and one-click reporting, you can track every core metric and cloud-native KPI without wrangling spreadsheets or stitching together siloed tools.
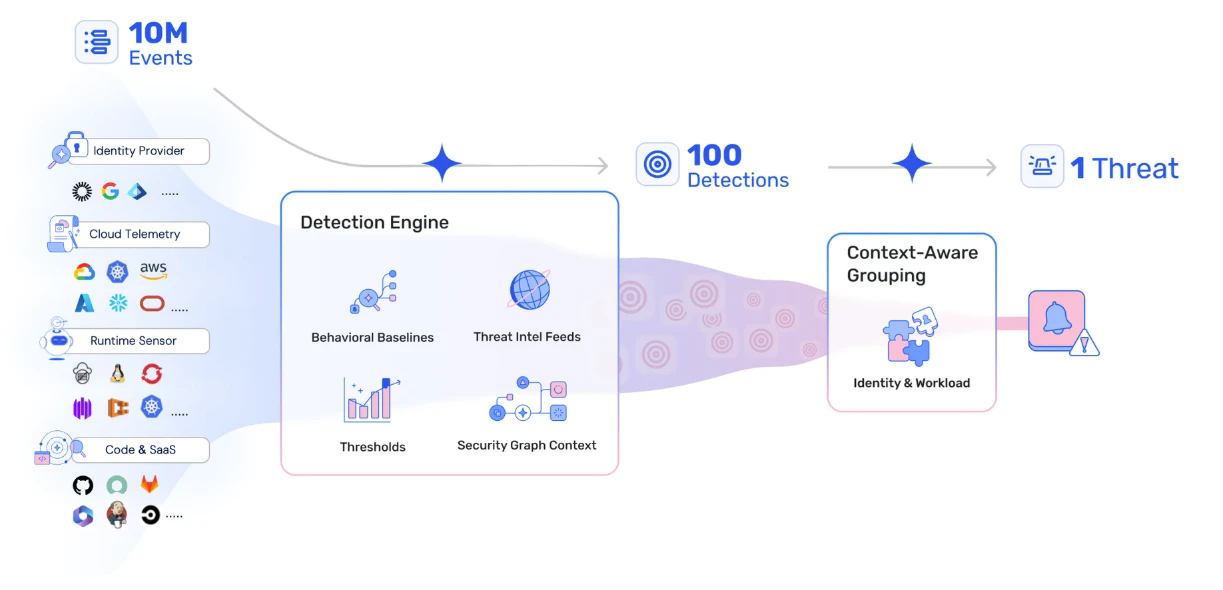
Wiz Defend continuously monitors cloud, identity, data, network, and runtime layers, surfacing actionable detections that feed directly into your Mean Time to Detect and Mean Time to Acknowledge metrics. The Investigation Graph automatically correlates related events, building a full attack narrative so you can measure how quickly incidents are understood and triaged.
The Wiz Runtime Sensor captures real-time workload activity and forensic evidence to help you quantify Mean Time to Contain. The Security Graph overlays resource context and relationships, letting you instantly visualize blast radius, data exposure, and recovery timelines for accurate impact measurement.
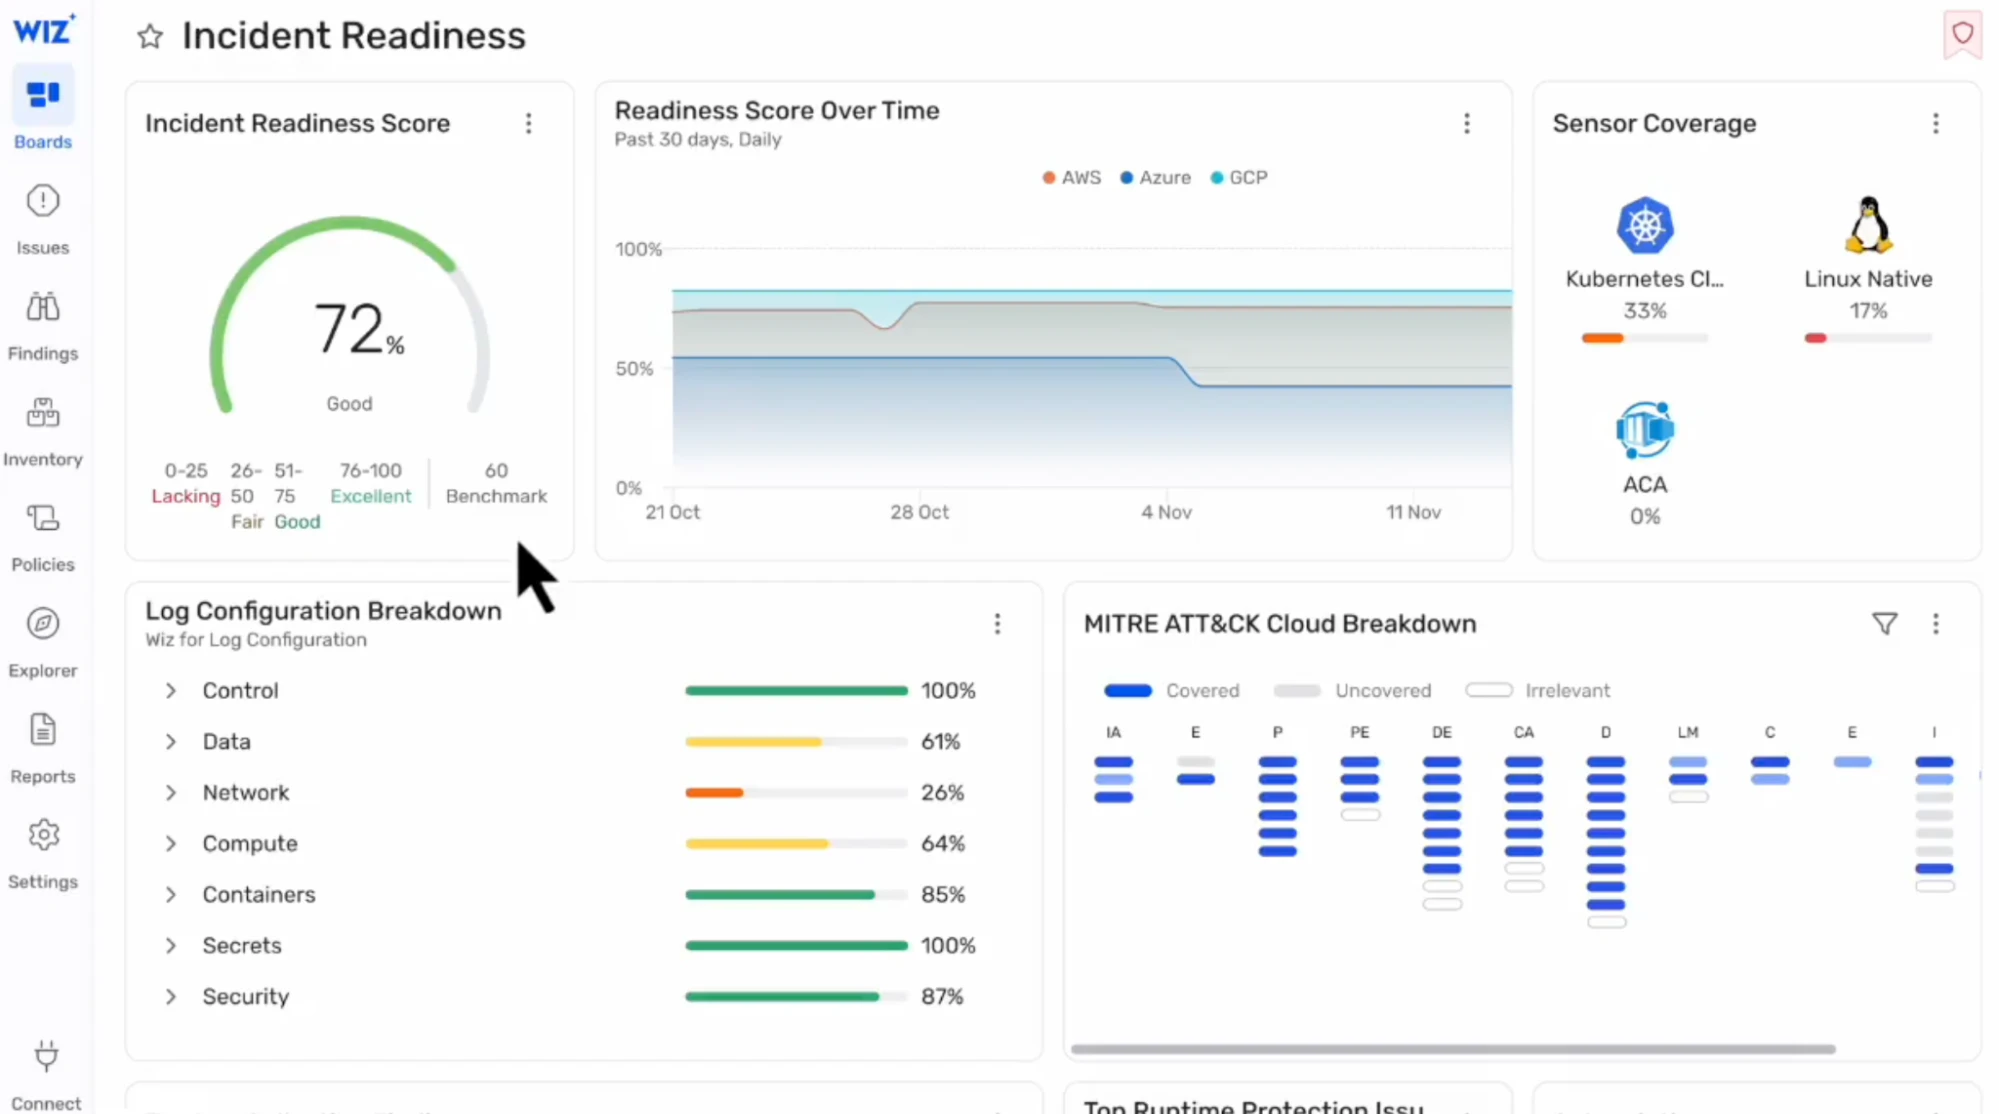
With cloud-to-code traceability, Wiz makes it easy to tie incidents back to source code and developer ownership – so you can track fix rates, reopen rates, and Mean Time Between Incidents with confidence. The Incident Readiness dashboard automatically maps your detection coverage to the MITRE ATT&CK cloud matrix, highlighting gaps and enabling continuous improvement without manual audits.
Request a demo to see how agentless visibility, attack path context, and code-to-cloud analytics make every incident response metric measurable and actionable – right out of the box.
When comparing platforms, prioritize unified scanning, contextual risk views, and end-to-end traceability so SecOps, CloudSec, and Dev can all measure and improve together.
Cloud-Native Incident Response
Learn why security operations team rely on Wiz to help them proactively detect and respond to unfolding cloud threats.
