Kubernetes has become the foundation of how teams build and run modern applications. It simplifies the deployment and management of containers across environments, but that flexibility also adds complexity. Clusters often run different versions and layer on add-ons like service meshes, ingress controllers, and monitoring tools. Over time, unmanaged resources such as manually installed Helm charts or Custom Resource Definitions (CRDs) fall outside standard pipelines. The result is that Platform and Security teams lose visibility into what’s actually running and how services communicate across clusters, creating blind spots when issues arise.
Wiz continues to deepen visibility into Kubernetes with two enhanced capabilities: the Kubernetes Bill of Materials (KBOM) and the Network Graph powered by the Wiz Runtime Sensor. KBOM gives teams a complete inventory of the technologies running across clusters, including unmanaged or shadow resources that would otherwise go unnoticed. The Network Graph builds on existing cloud and container visibility to show how Kubernetes resources connect to services such as AI platforms, messaging queues, and SaaS applications. This helps teams identify communication paths and potential risks, such as a deployment communicating with an external AI model on the internet. Together, these capabilities give Platform and Security teams a shared, real-time view to secure Kubernetes environments with confidence.
Kubernetes Visibility: See What’s Really Running
A Kubernetes Bill of Materials (KBOM) is like an SBOM, but for your clusters. It gives teams instant visibility into every workload, object, and technology running inside, including unmanaged or shadow resources that would otherwise go unnoticed.
Here’s how teams can use KBOM in practice:
Example: The IngressNightmare vulnerabilities in Ingress-NGINX left more than 40 percent of environments exposed to takeover. One of the most challenging tasks for security teams was simply identifying which clusters were running Ingress-NGINX and at what version.
Immediate visibility: KBOM makes that process instant. It groups technologies such as Istio, Envoy, PostgreSQL, and Ingress-NGINX by cluster, showing exactly where vulnerable components are deployed. Any risks discovered in these technologies are automatically correlated with other findings like exposed identities or internet-facing endpoints to surface toxic combinations within Wiz Issues. This gives teams the context they need to prioritize and remediate Kubernetes risks effectively.
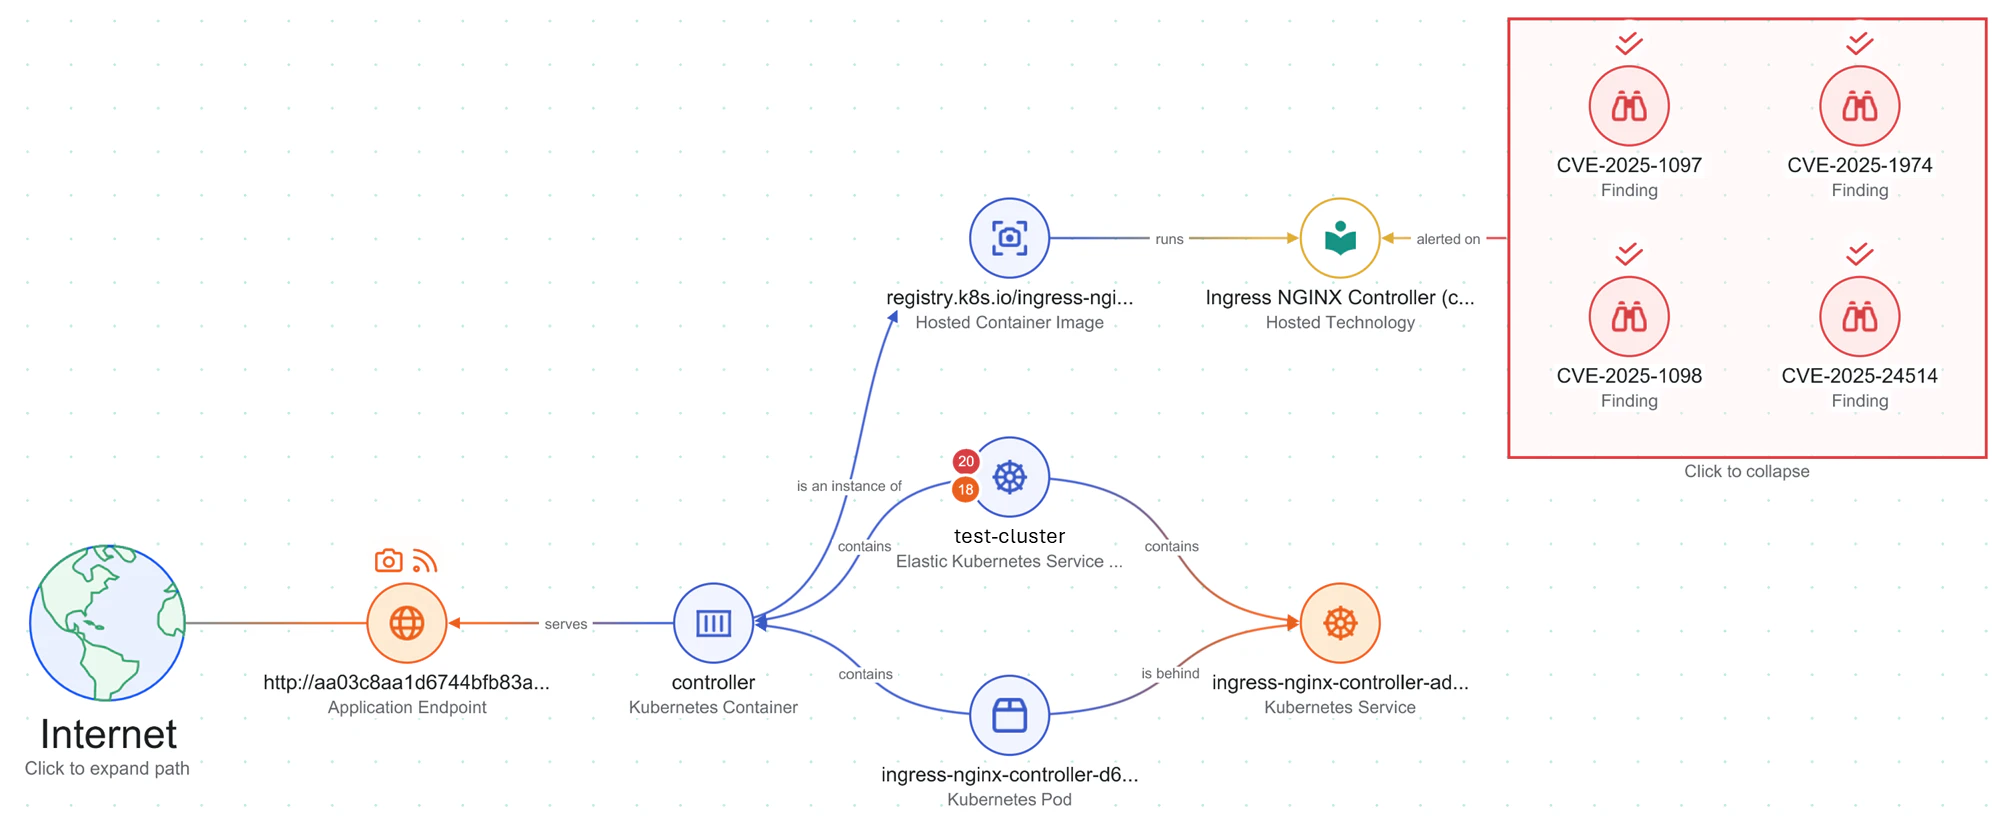
Version drift: If one cluster runs an older version than its peers, KBOM highlights the drift, allowing Platform and Security teams to quickly identify which clusters are exposed, prioritize upgrades, and confirm that patches have been applied.
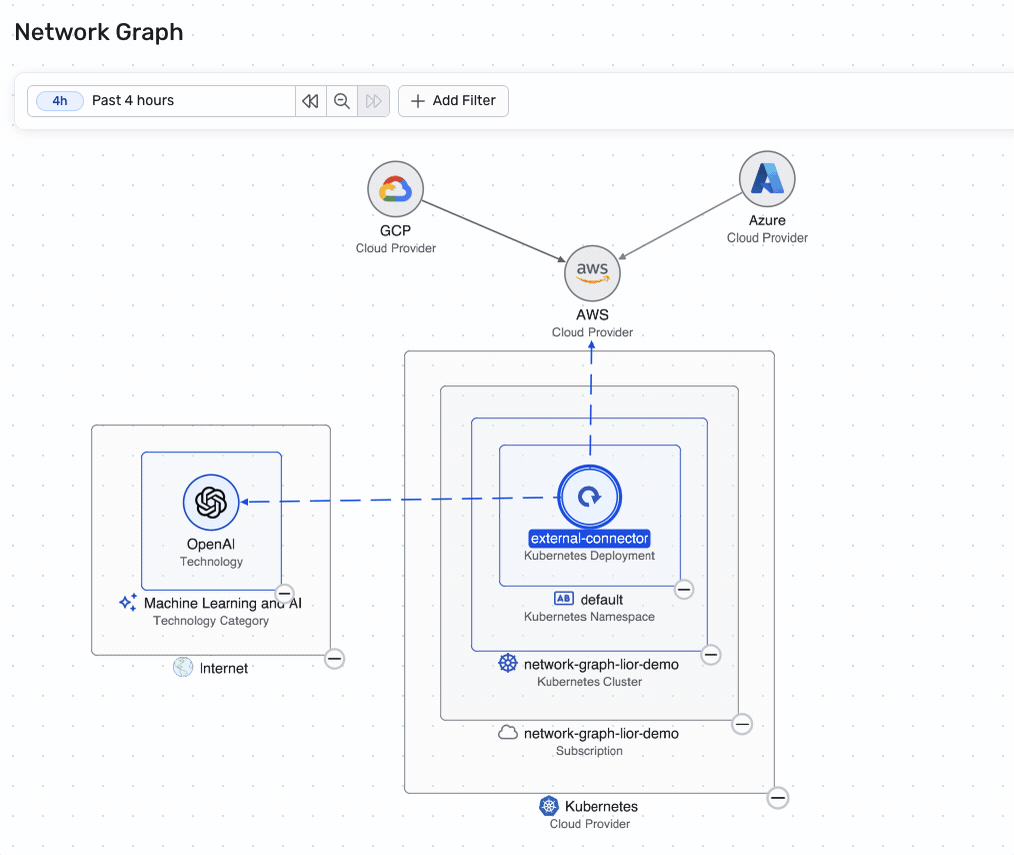
Network Graph: Map Services Communication Across Clusters
Networking in Kubernetes is often a black box. Teams can see what is deployed, but not how technologies communicate across clusters. The latest update to the Wiz Network Graph introduces the ability to visualize communication between deployments and the services they connect to, such as AI platforms, messaging queues, and SaaS applications. Visibility extends up to the deployment level, helping teams identify patterns and potential risks, like a Kubernetes deployment connecting to an external AI model. This context helps Platform and Security teams understand traffic flows and secure them with confidence.
Here’s what that visibility enables:
See communication paths: Identify which kubernetes deployments are communicating with each other, where open ports exist, and how traffic flows across clusters and regions.
Detect unexpected activity: Highlight external connections or cross-region traffic that deviate from expected patterns, helping teams minimize unnecessary data transfer and associated costs.
Accelerate investigations: Tie network flows back to workloads to trace the source of suspicious activity or performance issues quickly.
Validate configurations: Help the Platform and Security teams identify ingress misconfigurations, close unintended routes, and confirm that segmentation and access controls are functioning as intended.
The Network Graph helps teams move from assumptions to evidence. It turns network visibility into understanding, showing exactly how services communicate and where to focus attention.
Turning Kubernetes Visibility Into Action
Visibility is powerful only when it helps teams act. With a shared view of their Kubernetes environment, Platform and Security teams can move from firefighting to confident, coordinated remediation:
See What’s Running with KBOM: Instantly view every technology running in each cluster to understand what’s in use, where it’s deployed, and what needs attention. Platform Engineers and Security teams share the same view, making it easier to prioritize what matters.
Keep Clusters Consistent with KBOM: Identify version drift and configuration gaps across clusters, such as differences in RBAC, network policies, or runtime settings. Spot mismatches between environments like staging and production to ensure consistency and policy alignment.
Identify Exposures with the Network Graph: Reveal communication paths between deployments and external services to pinpoint where vulnerable or misconfigured components are exposed. Understand how traffic flows across clusters, namespaces, and cloud resources to focus remediation where it matters most.
Troubleshoot and Contain Issues with the Network Graph. Visualize network activity, including east-west, cross-cluster, and cluster-to-cloud flows. Spot misconfigurations, debug connectivity or performance issues, and reduce unnecessary traffic, helping Platform and Security teams secure Kubernetes with full context.
Business Value of Kubernetes Visibility
Visibility is not just about understanding Kubernetes, it is about driving better outcomes across the business. With runtime context, Platform Engineers and Security teams can turn insights into real impact:
Lower Costs: By tying architecture and traffic patterns to cost, teams can quickly spot wasteful cross-region flows, idle services, and over-provisioned clusters. Cloud cost optimization is not only a finance task. Engineering and Security both need shared visibility to make smart, data-driven decisions.
Less Risk: Eliminating shadow resources, addressing critical vulnerabilities, and aligning cluster configurations all reduce the attack surface. Wiz enriches this context by correlating runtime data with network exposure, identity, and data sensitivity, turning isolated findings into actionable insights.
More Reliable Apps: End-to-end visibility across clusters and services helps teams detect misroutes, latency spikes, and unexpected traffic patterns before they affect users. With enriched context connecting infrastructure, workloads, and networks, root-cause analysis becomes faster and resolution more precise.
The Bigger Picture
Kubernetes visibility bridges the gap between intent (the configurations you write) and reality (what actually runs). In hybrid and multi‑cloud environments, traditional tools force teams to cobble together separate scanners and piece together the story. Wiz’s approach unifies inventory, runtime context, and security graph so Platform Engineers and Security teams can see everything in one place and take decisive action.
If you’re a Wiz customer, check out (login required) the KBOM and Network Graph capabilities and gain visibility into your Kubernetes clusters today.