In the context of cloud security, Incident Response (IR) teams face the daunting task of swiftly detecting, analyzing, and mitigating incidents. For that reason, organizations like SANS and NIST created IR frameworks that help incident responders to speed the process from detecting an incident, through its containment, and eventually recovering from it.
When a potential incident occurs, it's crucial to be able to quickly and accurately assess the potential impact of a compromised resource such as a VM or container and pinpoint the root cause of the incident (how the attacker got in). It's also important to understand what potential next steps a malicious user can (and cannot) take. This will help you secure your crown jewels and move quickly to an efficient containment phase.
The cloud native forensics approach
Wiz continues to extend its forensics offering and provides an automated Root Cause and Blast Radius Analysis based on the Wiz Security Graph. Wiz Forensics gives customers the ability to automatically collect important evidence when a resource may have been compromised. For example, customers can copy the volume of the virtual machine, download the “Forensics Package” with all important logs and artifacts from the machine to start the initial triage, and use the runtime sensor to view the different processes that ran on the containers or virtual machines.
The automated Blast Radius assessment saves IR teams crucial time by answering two important questions:
How was the resource compromised? For example, "did the attacker exploit a vulnerability? Did they use stolen credentials to authenticate?”
Looking at a resource where compromise is suspected: where can an attacker potentially move in the environment, and what would be the business impact? That is, “is there a path to get from this resource to sensitive data? Does it have access to highly privileged cloud role?”
The power of the Security Graph with runtime monitoring
Picture this: a virtual machine (VM) or container within your public cloud infrastructure has been compromised. The clock is ticking, and you need answers — fast. This is where Wiz’s Security Graph comes into play and enhances your incident response capabilities.
At its core, the Security Graph is a graph database that meticulously simulates your cloud infrastructure and captures real-time events from your cloud provider. Wiz’s unique graph approach to cloud security makes it an excellent tool for incident response investigations; this digital twin of your environment allows you to visualize and understand the potential impact of a security incident, also known as the "blast radius."
Wiz is also continuously monitoring your workloads for suspicious activity in runtime. Based on both the Wiz sensor and the ingestion of cloud events, it can add runtime context to the blast radius analysis, such as suspicious events performed by the machine’s service account or by a specific user.
Understanding the blast radius
The term "blast radius" refers to the extent of damage or impact a security incident can have on your cloud environment. In the context of cloud security, knowing the blast radius is crucial for mitigating risks and minimizing disruptions. With the Security Graph, Wiz empowers IR teams to:
Identify the scope of impact: When a VM or container is compromised, you can quickly determine which other resources are at risk. The Security Graph maps out the relationships and dependencies, giving you a clear picture of what's on the line.
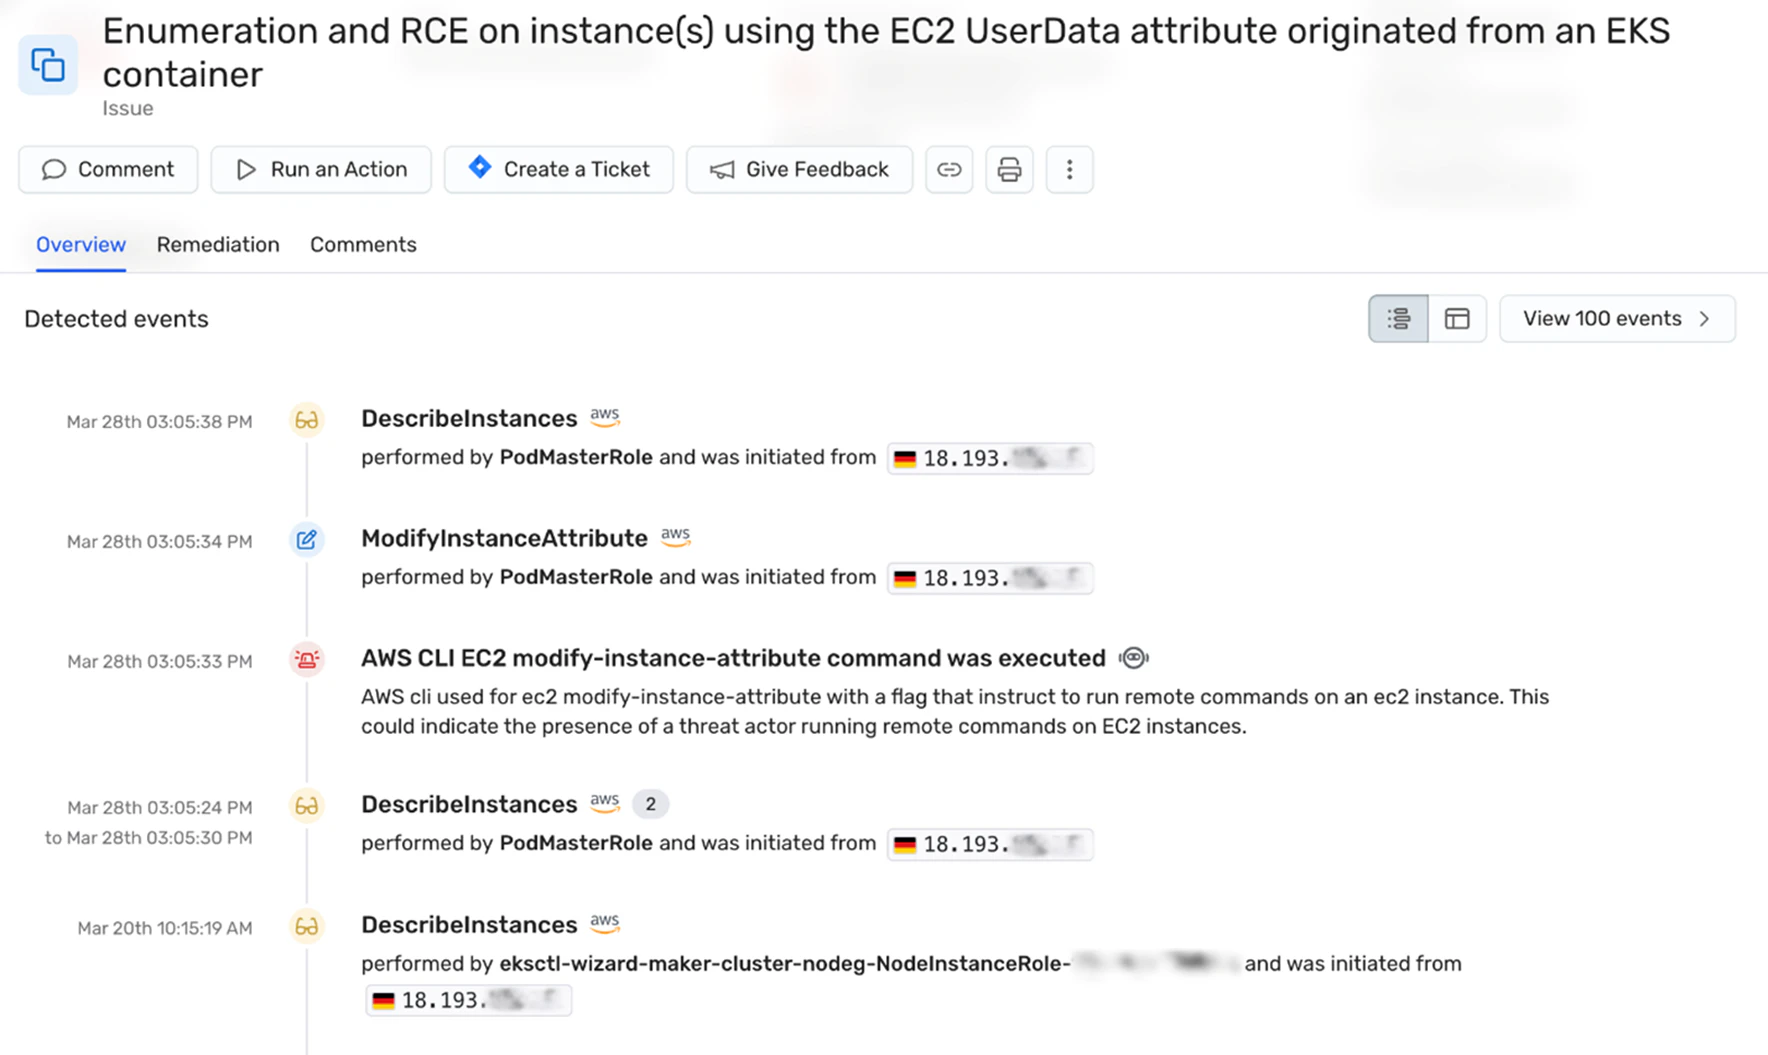
Trace the attack path: Understanding how the security breach occurred is just as vital as knowing its scope. The Security Graph can trace potential attack paths, providing insights into how the attacker might have gained access and moved laterally within your environment by abusing cleartext secrets or escalating user privileges. Additionally, the Wiz CDR can highlight recent activity involving the compromised resource, to help you figure what actions the attacker performed within your environment.
Spot the root cause: Pinpointing the root cause of a security incident can be like finding a needle in a haystack. The Security Graph, however, makes it a breeze. Whether it's a vulnerable software component, a misconfigured access control, or an exposed SSH key, you can quickly zero in on the culprit.
For Kubernetes namespaces in particular, Wiz has open-sourced our blast radius calculation method and released NamespaceHound to detect the risk of potential namespace crossing violations. In Wiz, this analysis is done automatically and out-of-the-box for every namespace in the environment.


A Real-World Example
Let's dive into a real-world scenario. You get an alert on suspicious events occurring in one of the virtual machines in your environment.
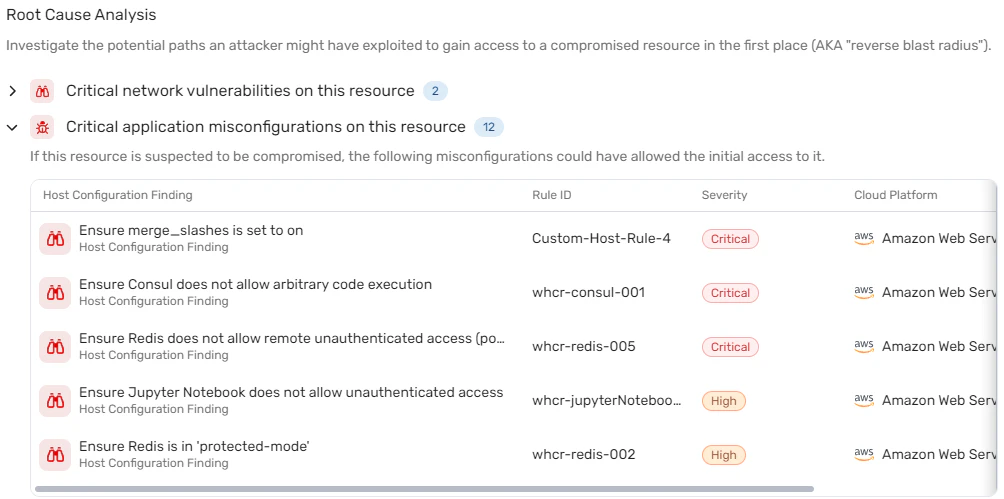
By reviewing the results of the automated root cause analysis, we can immediately see that the machine has been affected by multiple critical vulnerabilities as well as several misconfigurations, such as a Jupyter notebook instance allowing unauthenticated access.
Then, as a responder, you can use Wiz forensics capabilities to copy the machine’s volumes to your forensics account and simultaneously download the forensics package to find any trace of malicious activity in the logs, which also include the Jupyter Notebook audit logs.
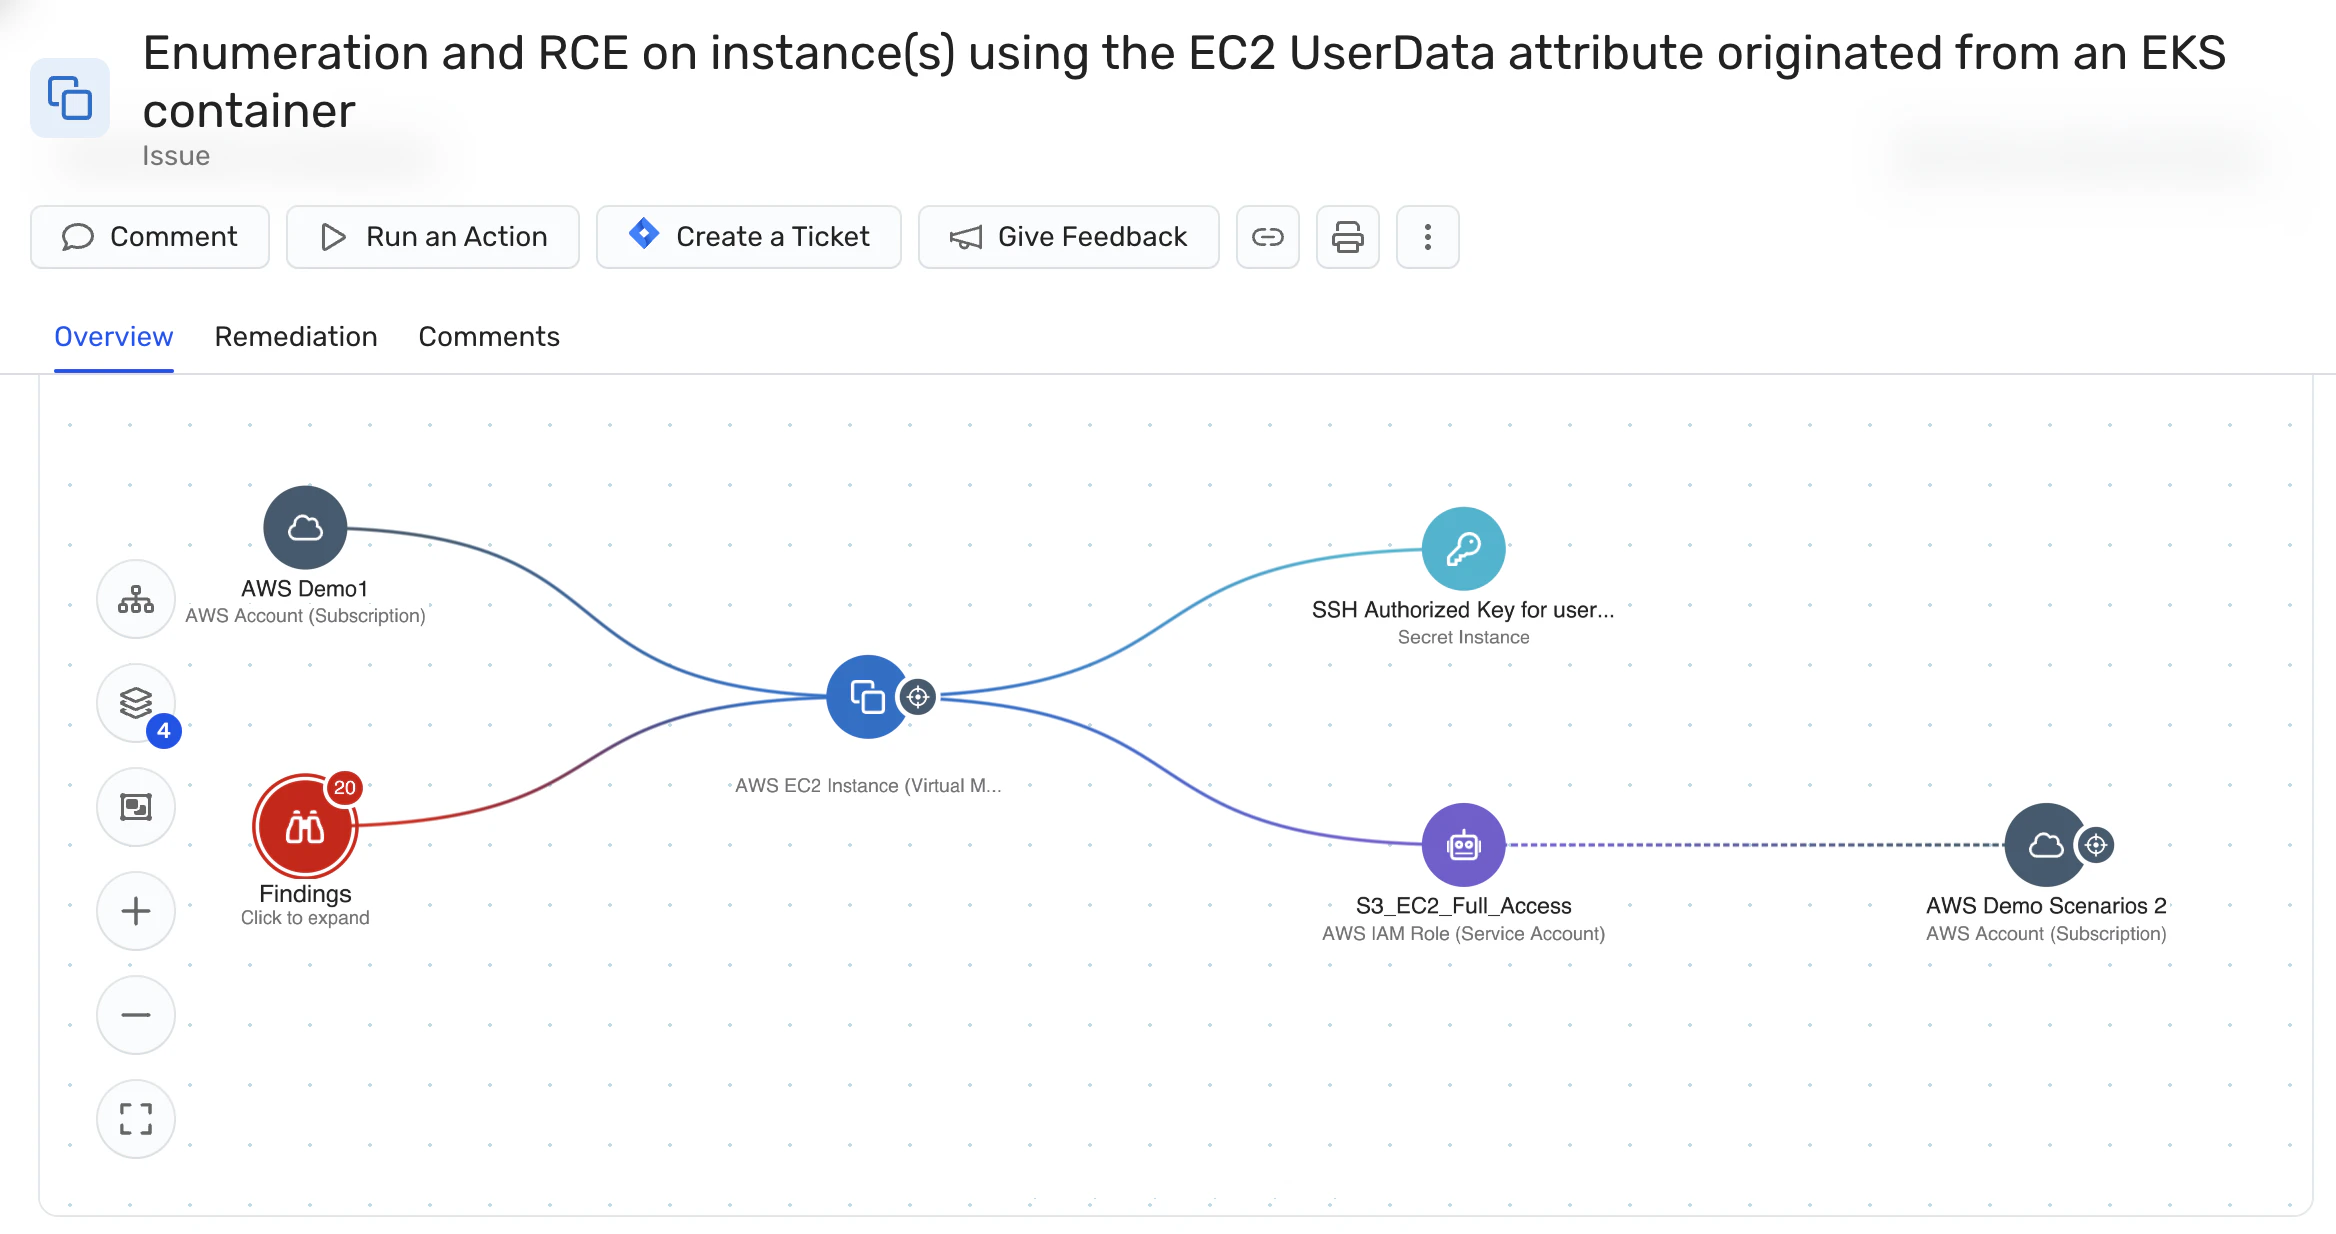
Moving on, using the results of the automated blast radius analysis, we can see the machine has a cleartext private key that can lead to privilege escalation. In this case, you should immediately rotate the key and also review all associated cloud events associated with it to see if it was abused by the attacker, and to what end.
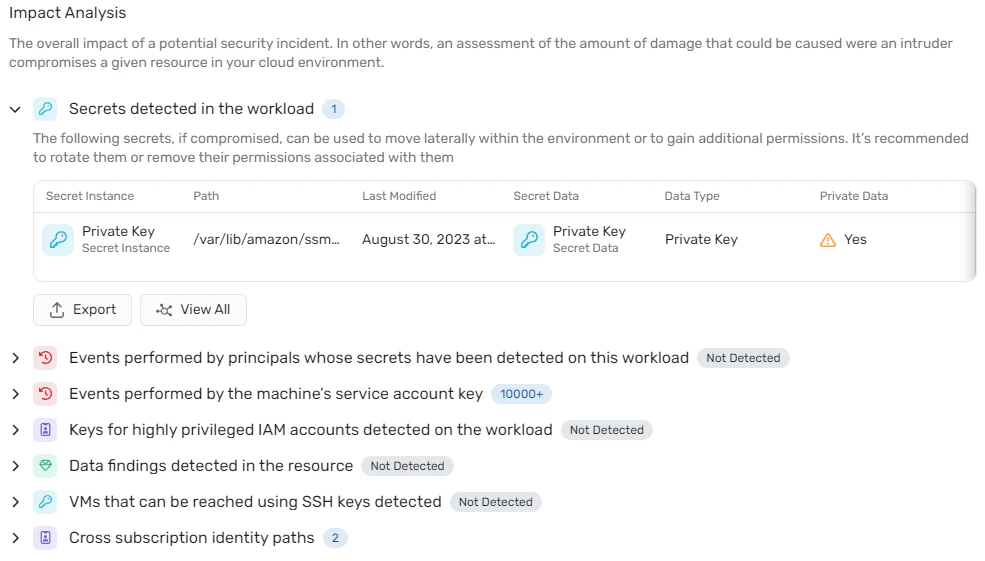
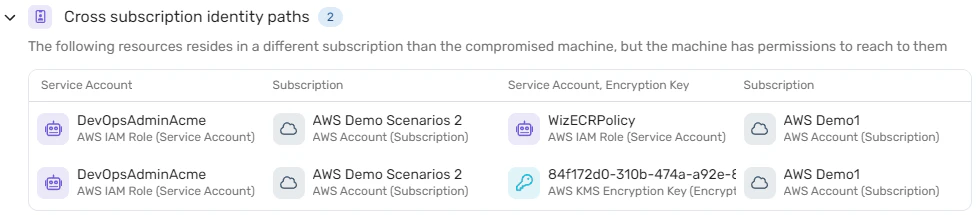
In addition, we can see that there are two cross-subscription identity paths from the machine to a role and a KMS key in another subscription. To verify whether the attacker used those paths we can review the events performed by the machine’s service account and check for any suspicious activity related to the role or the key, with the goal of understanding the scope of the attack and deciding on containment steps.
Out-of-the-box experience with immense value
In the world of cloud security, time is of the essence. The Security Graph is a powerful ally for Incident Response teams in the world of public cloud infrastructure. It's not just about responding to incidents; it's about responding smarter and faster.
Wiz's automated blast radius and root cause analysis assist IR teams by providing them with the most relevant information, so they can respond effectively and efficiently. Customers derive value from the visibility, simplicity, speed, and precision of this offering.
Ready to enhance your cloud incident response capabilities?
Contact Wiz today and unlock the full potential of the Security Graph. Your cloud security has never been in better hands.