


How container monitoring tools work
Container monitoring tools track real-time metrics like CPU, memory, network traffic, errors, and restarts to help you understand how applications behave in dynamic environments. They surface insights at both the container and orchestrator levels, integrating with platforms like Kubernetes to collect telemetry from pods, nodes, and services.
But observability isn’t security. Monitoring tools identify performance issues, not security threats. They don’t detect container escapes, malicious activity, or misconfigurations. That’s why teams often pair observability with dedicated cloud security platforms like Wiz to cover what monitoring misses.
Modern tools enrich telemetry with metadata, visualize trends through dashboards, and trigger alerts on anomalies. Some support distributed tracing to pinpoint issues in microservices. To handle the short lifespans and scale of containers, they rely on lightweight agents, sidecars, or service meshes that minimize performance impact.
Container Security Cheat Sheet
Get a quick-reference guide to container security best practices that go beyond monitoring.

Popular container monitoring tools
As container adoption accelerates, a diverse set of monitoring tools has emerged to support modern infrastructure. Choosing the right solution depends on several key factors:
Metrics coverage: Does the platform capture detailed telemetry like CPU, memory, network, and application metrics?
Kubernetes integration: How well does it support container orchestration platforms like Kubernetes?
Scalability: Can it handle high-cardinality data and multi-cluster environments?
Visualization depth: Does it provide intuitive, real-time dashboards and alerting?
Cost and licensing: How does pricing scale with usage, data volume, or feature tier?
Extensibility: Can the tool integrate with your existing stack (e.g., CI/CD, cloud platforms, third-party tools)?
Explore seven widely used options below, each with unique strengths across these categories.
1. Wiz: Best all-in-one container and cloud monitoring platform
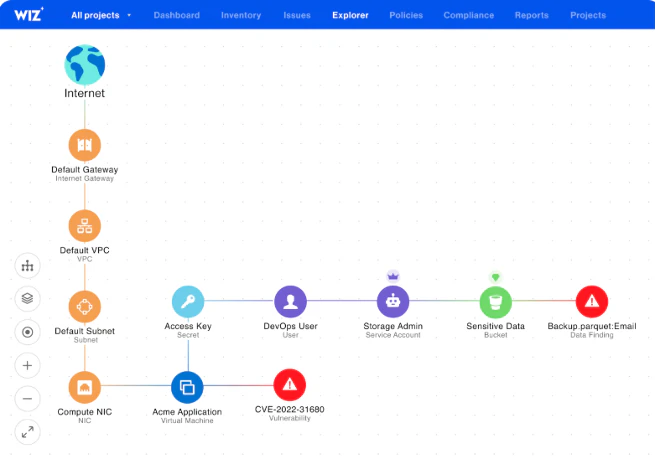
Wiz is a unified cloud native application protection platform (CNAPP) for the modern cloud era. The Wiz CNAPP provides real-time, agentless visibility into containerized environments. It delivers deep context on vulnerabilities, misconfigurations, exposed secrets, network risks, and toxic combinations.
The platform removes complexity by consolidating security features into one platform, empowering security and DevOps teams to detect, prioritize, and remediate issues faster across the entire cloud stack.
Wiz provides comprehensive coverage on a single platform, eliminating the need for multiple siloed tools. Organizations of all sizes and levels of cloud maturity can leverage the unified platform to reduce alert fatigue, accelerate remediation, and scale security alongside innovation.
Key features:
Agentless scanning: Delivers full visibility across containers, VMs, serverless, and Kubernetes without impacting performance.
Risk prioritization: The Wiz Security Graph correlates vulnerabilities, identities, and network exposure to highlight the most critical risks.
Exposure analysis: Maps attack paths and detects toxic combinations to reveal how attackers could move through your environment.
Compliance mapping: Automatically checks your environment against 100+ frameworks, including CIS, PCI, NIST, HIPAA, and GDPR.
Easy onboarding: Provides immediate insights and integrates with CI/CD pipelines to shift security left.
What to look out for: Wiz delivers the most value in cloud-native environments through its shift-left, democratized security model, which thrives when your security, DevOps, and engineering teams align culturally and collaborate. However, implementation can require organizational change and may have a limited impact on legacy on-prem systems.
2. Prometheus: Popular for Kubernetes environments
")
Prometheus is an open-source monitoring system for dynamic infrastructures, especially Kubernetes. It scrapes metrics from configured endpoints at specified intervals, stores them in a time-series database, and supports powerful querying and alerting features.
Key features:
Multidimensional data model: Stores time-series data enriched with labels for powerful metadata context.
Flexible query language (PromQL): Enables deep metric analysis and custom aggregations for precise insights.
Dynamic target discovery: Supports service discovery and static configs to locate scrape targets automatically.
Integrated alerting: Triggers notifications based on custom-defined conditions via the built-in engine.
What to look out for: Teams unfamiliar with PromQL and time-series concepts may face a steep learning curve, and scalability can become a limitation in large, multi-cluster environments without federation or long-term storage integrations.
3. Grafana: Popular choice for strong visualization
")
Grafana isn’t a standalone monitoring solution, but it excels at visualizing data from various sources. Teams often pair it with tools like Prometheus to build dynamic dashboards that offer clear, real-time insights into container and infrastructure performance. Its versatility and ease of use make it a popular choice for any organization seeking a customizable front end for its monitoring stack.
Key features:
Flexible visualization: Supports a wide range of observability use cases with rich charting and dashboards.
Tool integrations: Connects easily with Prometheus, Datadog, Loki, and other key observability platforms.
Advanced alerting: Uses flexible notification channels, like Slack, PagerDuty, and email, to stay ahead of issues.
User-friendly interface: Enables fast setup and ease of use for new users with a low-overhead UI.
What to look out for: The platform offers limited native monitoring and relies on external data sources for metrics. It also lacks built-in anomaly detection or machine learning features to help teams proactively identify issues.
4. Datadog: Popular for extended observability for container monitoring
")
Datadog is a full-spectrum observability platform that delivers end-to-end insights across cloud-native environments. While it goes far beyond containers, Datadog stands out as an extended observability platform that offers rich telemetry into containerized workloads. Its strength lies in unifying performance data across infrastructure, apps, and services into a single consolidated view, making it ideal for mature teams operating at scale.
Key features:
Real-time tracking: Delivers instant performance visibility with fully customizable dashboards.
Container observability: Provides deep, native insights into containers, Kubernetes, and microservices.
Extensive integrations: Connects with over 400 tools, including cloud platforms and CI/CD pipelines.
Anomaly detection: Uses machine learning to identify outliers and accelerate root cause analysis.
Centralized logging: Consolidates logs in a single location to streamline investigation and incident response.
What to look out for: While offering rich functionality, the platform can introduce a steep learning curve for new users and quickly drive up costs in large environments or with high data volumes.
5. Dynatrace: Popular for AI-powered root cause analysis
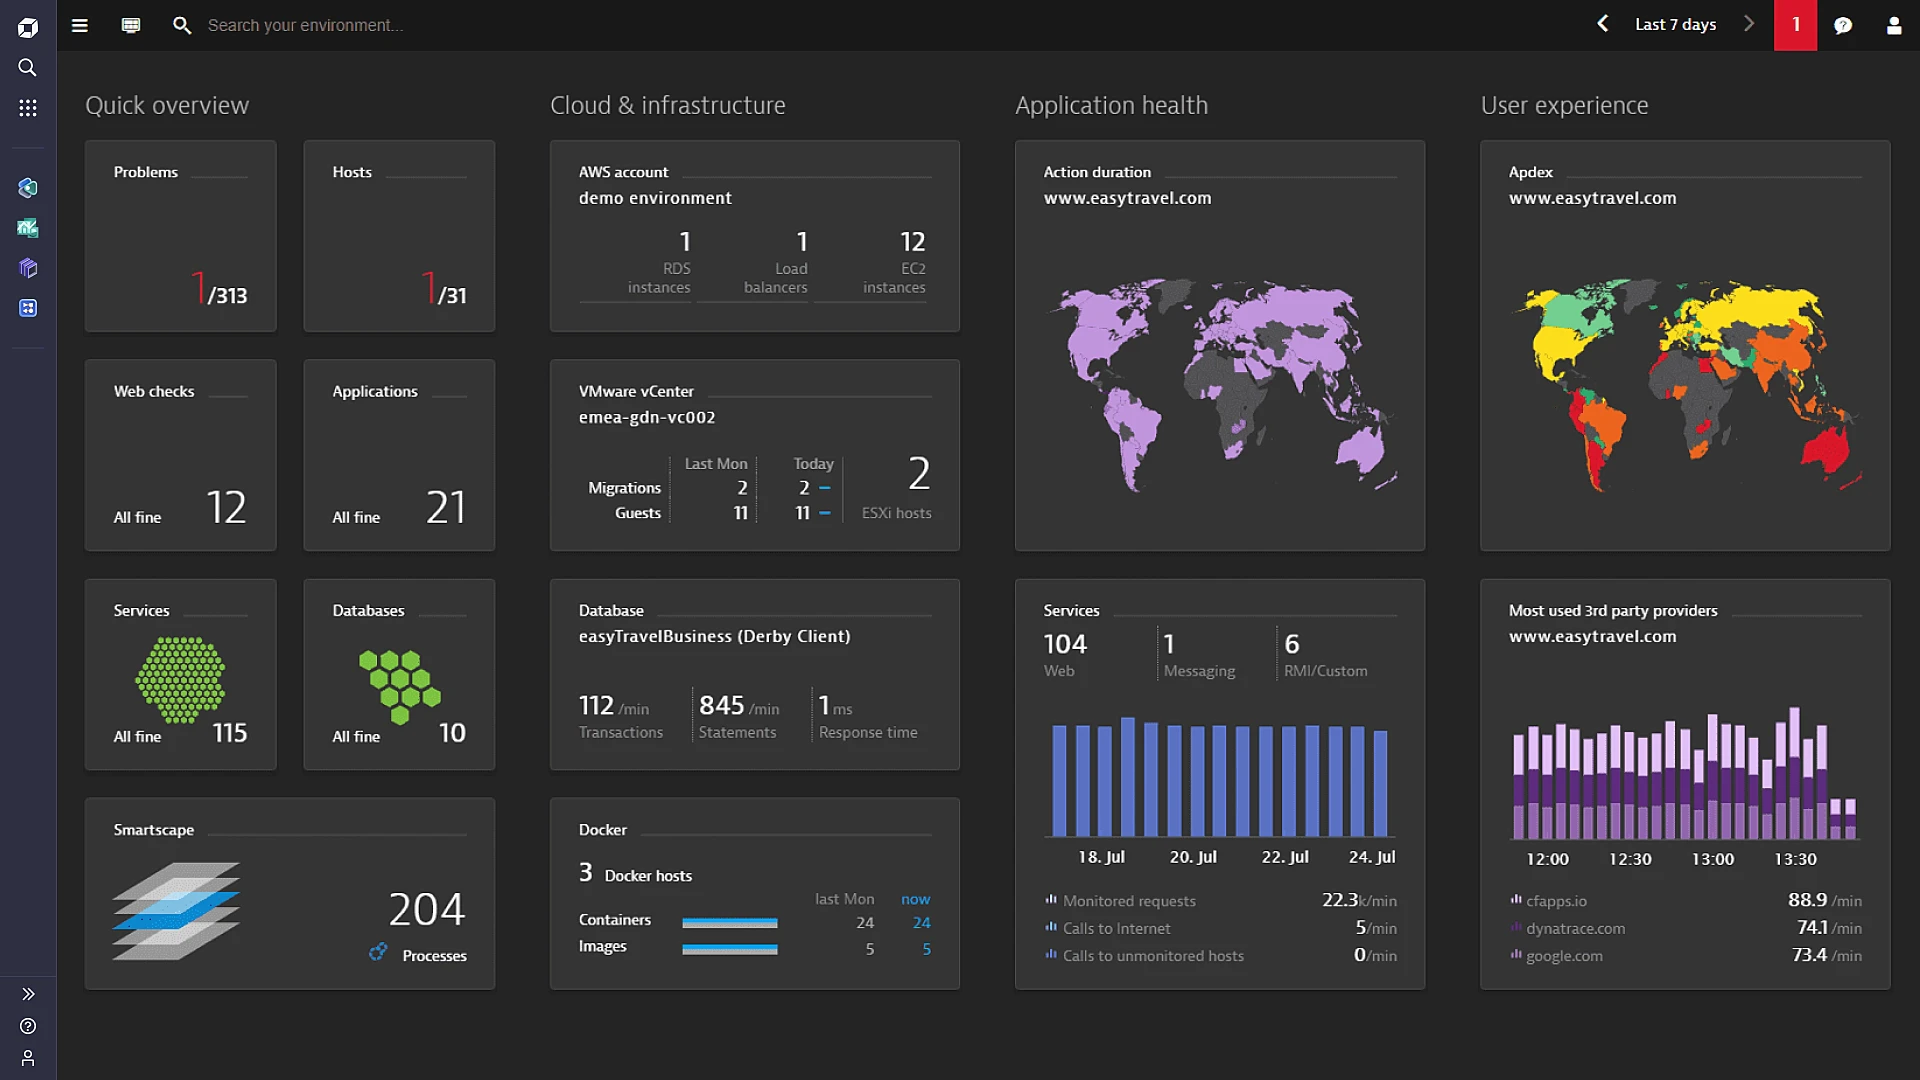
Dynatrace is an AI-powered observability platform built for full-stack monitoring. It provides deep visibility into modern environments by automatically instrumenting applications and mapping dependencies across every layer of the stack, including containers and Kubernetes. Automation enables teams to detect, understand, and resolve issues faster.
Key features:
AI-driven insights: Uses the Davis engine and machine learning for anomaly detection and automated root cause analysis.
Automatic discovery: Detects containerized workloads and services without manual setup.
Full-stack visibility: Monitors infrastructure, applications, and Kubernetes clusters from a single view.
Kubernetes monitoring: Provides native insights into pod health, resource usage, and cluster-level events.
What to look out for: The platform can become costly in large-scale environments and may generate alert noise if not finely tuned for applications with complex dependencies.
6. Sysdig: Popular for container runtime security
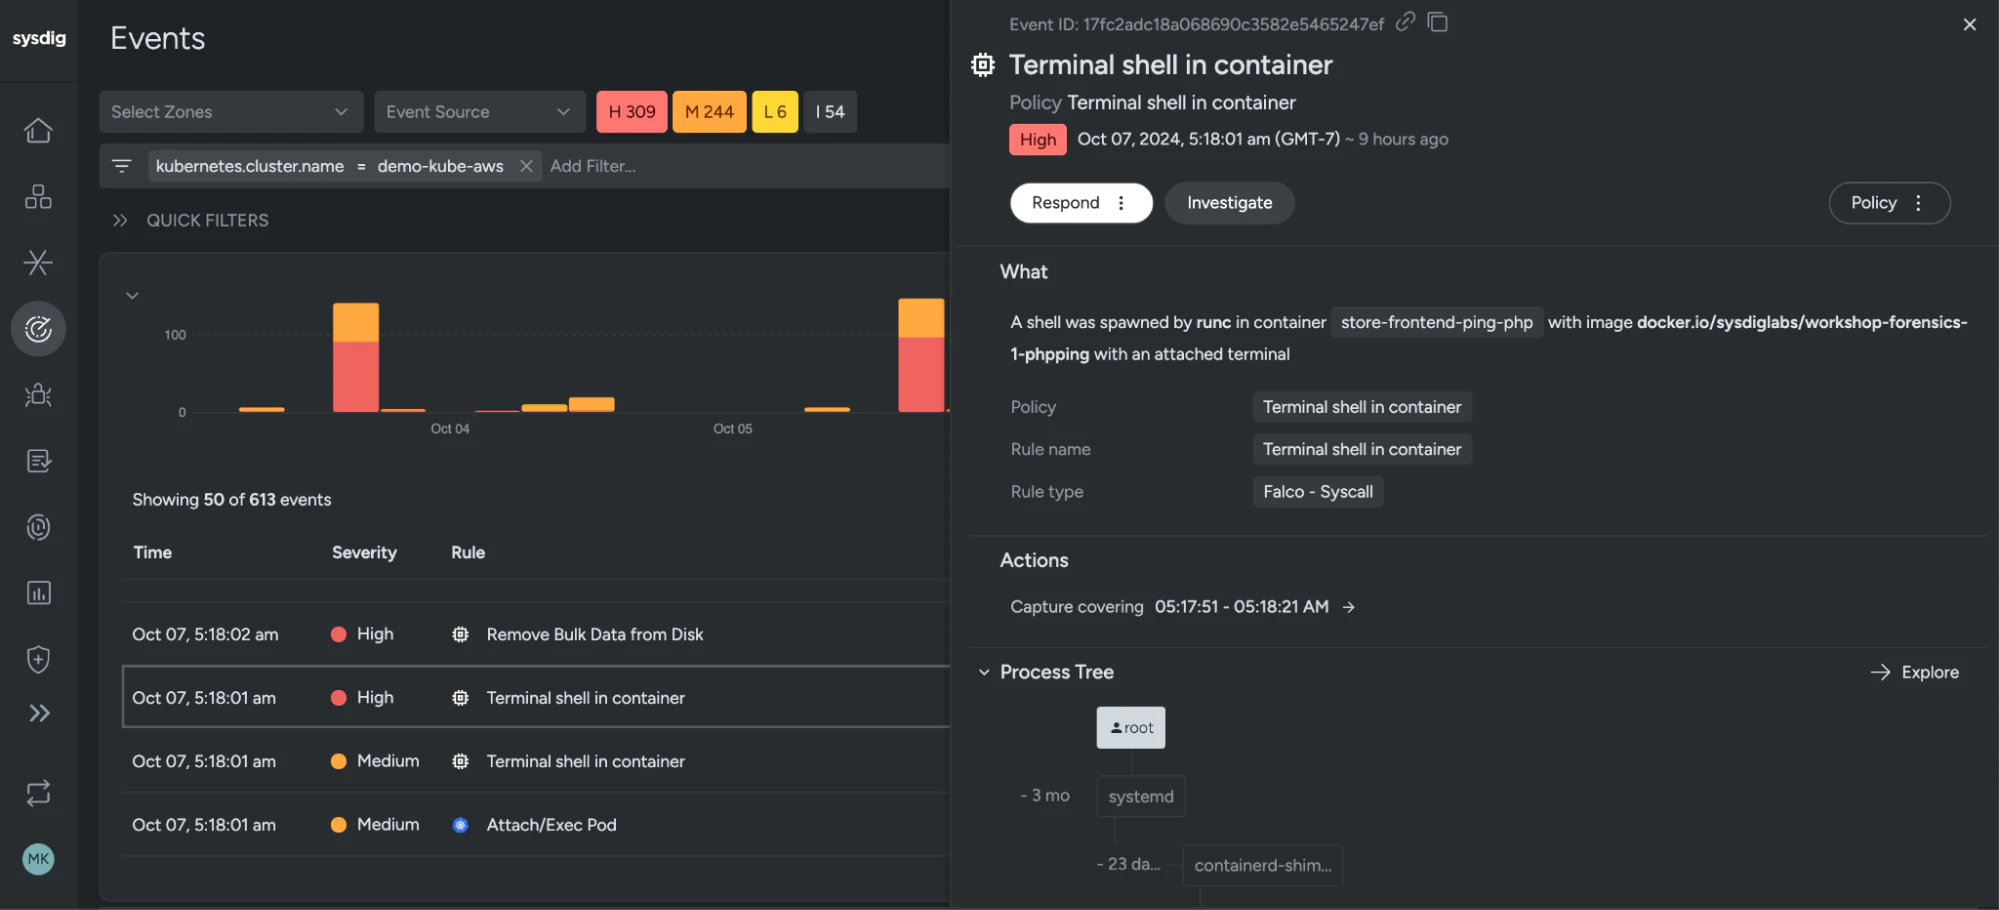
Sysdig is a container runtime security and observability tool designed for DevSecOps teams managing cloud-native infrastructure. It combines real-time threat detection, deep forensics, and compliance tracking to secure workloads in production. While it includes monitoring features, its primary focus is on runtime protection and operational visibility across Kubernetes environments.
Key features:
Runtime security: Gains deep visibility into processes and system calls to detect threats in real time.
Behavioral detection: Uses Falco rules to identify suspicious activity based on runtime behavior.
Audit monitoring: Tracks user actions and policy violations with Kubernetes audit log analysis.
Compliance and forensics: Performs detailed activity tracing to support investigations and regulatory requirements.
What to look out for: The UI can feel security-centric and less intuitive for general DevOps users. There is also potential feature overlap in environments already using CNAPP or CSPM tools.
7. New Relic: Popular for unified observability and APM

New Relic provides full-stack observability by unifying APM, metrics, logs, and traces within a single platform. It also delivers real-time Kubernetes insights, helping teams quickly identify and resolve performance bottlenecks. With flexible dashboards, customizable alerts, and deep telemetry across distributed systems, New Relic is ideal for performance-focused teams that need to optimize application health, ensure uptime, and accelerate incident resolution.
Key features:
Integrated observability: Monitors containers, services, and infrastructure from a unified platform.
Kubernetes explorer: Visualizes real-time pod and node health across your clusters.
Built-in APM: Tracks application transactions and identifies bottlenecks with native monitoring tools.
ML-powered detection: Leverages machine learning to surface anomalies before they impact users.
What to look out for: Premium features are gated behind higher-tier plans, and advanced customization of dashboards and alerts can involve a steep learning curve.
Container monitoring challenges
Container monitoring provides critical visibility—but presents unique challenges. As containerized environments scale, you need strategies and tools that adapt to their dynamic nature and overcome core obstacles. Explore some common challenges below, along with practical guidance to overcome each one:
| Challenge | Description and guidance |
|---|---|
| Containers are dynamic, ephemeral, and scalable. | Containers often run for only a few seconds and scale constantly, making traditional monitoring tools ineffective. Use Prometheus and kube-state-metrics to monitor container state in real time. |
| Applications span multiple containers and services. | Modern applications rely on interconnected containers, so an issue in one can affect others. Use OpenTelemetry or Jaeger to trace requests across services and gain visibility into the full application path. |
| Integration with existing monitoring systems. | Many teams already use tools like Datadog, Splunk, or New Relic. Use Fluent Bit or custom adapters to send container logs and metrics into these platforms for a unified observability layer. |
| High data volume leads to alert fatigue. | Containers generate high volumes of telemetry, which can overwhelm teams. Use Prometheus Alertmanager to efficiently group and route alerts and build Grafana dashboards to highlight the most relevant signals and minimize noise. |
How to choose the right container monitoring tool
Selecting a container monitoring tool depends on the complexity of your environment, observability goals, and compatibility with your current stack. Evaluate your options based on the following decision points:
Integration capabilities: Select a tool that integrates seamlessly with your existing infrastructure and monitoring systems to avoid major rework.
Scalability: Ensure the tool supports dynamic container environments and scales reliably alongside your cloud workloads.
Feature set: Prioritize platforms that include real-time monitoring, alerting, service discovery, and out-of-the-box visualization.
Ease of use: Evaluate the user experience and learning curve, particularly for teams new to container or Kubernetes-based operations.
Cost and licensing: Consider how pricing scales with data ingestion, retention, and user seats, especially in high-cardinality or multi-cluster environments.
Watch 12-min demo
See how Wiz delivers unified visibility across your container and cloud environments.

Effective container monitoring best practices
To maintain performance, security, and resilience in containerized applications, it’s essential to adopt best practices that improve visibility and reduce manual troubleshooting. These techniques will help teams detect issues early and operate more efficiently:
Implement centralized logging
Centralized logging collects logs from all containers in a unified location, simplifying troubleshooting, event correlation, and security investigations for teams.
Here are some actionable tips to get started with centralization:
Identify a logging driver: Select a driver that’s compatible with your container runtime (e.g., Docker or containerd).
Deploy a log aggregator: Use tools like Grafana, Fluentd, and Fluent Bit to collect and forward logs to your central store.
Centralize your storage: Send logs to a cloud-native, searchable repository, such as Elasticsearch, Grafana Loki, or a managed log service.
Here’s what this looks like in practice:
For Docker best practices, you can configure your Fluentd logging driver like this:
{
  "log-driver": "fluentd",
  "log-opts": {
    "fluentd-address": "localhost:24224",
    "tag": "docker.{{.Name}}"
  }
}
For Kubernetes environments, deploy Fluentd or Fluent Bit as a DaemonSet to collect logs from all pods across the cluster. Then route those logs to centralized storage, such as Elasticsearch, Grafana Loki, or a cloud-native logging service like AWS CloudWatch Logs, for unified search, monitoring, and retention.
Set thresholds and alerts
You can detect security and performance issues more quickly by defining thresholds for key metrics and configuring alerts around them. This allows your team to act before problems affect users or critical systems.
Follow these actionable tips to get started on thresholds:
Establish key metrics: Focus on metrics that reflect container health and performance, such as CPU usage, memory consumption, network latency, response time, and error rates.
Clarify your baseline metrics: Analyze typical performance in your environment and only create essential alerts to avoid alert fatigue. To start, set achievable thresholds that reflect your infrastructure’s behavior.
Here’s what this looks like in practice:
Define the following Prometheus alert rule to trigger an alert when CPU usage exceeds 80% for more than five minutes:
groups:
  - name: container-resources
    rules:
      - alert: HighCPUUsage
        expr: rate(container_cpu_usage_seconds_total[5m]) > 0.8
        for: 5m
        labels:
          severity: warning
        annotations:
          summary: "High CPU usage detected"
          description: "Container CPU usage has been over 80% for more than 5 minutes."
You can also use Prometheus Alertmanager to send grouped notifications via Slack, PagerDuty, or email for timely awareness and action.
Integrate monitoring into CI/CD pipelines
Embed monitoring into your CI/CD pipeline to detect and resolve issues earlier in the development cycle. This integration reduces the risk of vulnerable or misconfigured containers reaching production and supports a shift-left security model.
Here are some ways you can integrate monitoring into your own pipelines:
Security in CI/CD: Check for misconfigurations and vulnerabilities during your build pipeline.
Image scanning: Scan container images during build stages using tools like Wiz, Trivy, or Clair.
Build enforcement: Automatically fail builds that breach security or performance thresholds.
Pipeline monitoring: Send telemetry to your observability platform to track pipeline health and deployment trends.
Here’s what this looks like in practice:
The following GitHub Actions snippet runs Trivy to scan container images during a build:
name: Container Security Scan

on: [push]

jobs:
  scan:
    runs-on: ubuntu-latest
    steps:
      - name: Checkout code
        uses: actions/checkout@v2

      - name: Run Trivy image scan
        uses: aquasecurity/trivy-action@master
        with:
          image-ref: your-container-image:latest
          format: table
          exit-code: 1
This setup fails the build if it detects vulnerabilities, providing teams with immediate feedback before deployment.
Regularly update monitoring configurations
Keeping monitoring configurations up to date is critical as your environment evolves. Regularly reviewing and adjusting your settings to maintain relevance, improve accuracy, and adapt to changes in infrastructure or applications.
Below are tips you can use:
Automate your configuration management: Use tools like Ansible, Puppet, or Terraform to deploy and update monitoring configurations automatically.
Regularly review: Schedule routine reviews of audit alert rules, dashboards, and metrics to confirm they continue to align with application changes and business priorities.
Leverage version control: Store monitoring configurations in Git or a similar version control system to track changes, enable rollbacks, and support team collaboration.
Here’s what this looks like in practice:
You can automate monitoring configuration updates using tools like Ansible:
# ansible-playbook prometheus_config_update.yml

- name: Automated Prometheus Configuration Management
  hosts: prometheus_servers
  become: yes

  vars:
    prometheus_config_path: /etc/prometheus
    config_file: prometheus.yml

  tasks:
    - name: Ensure Prometheus is installed
      package:
        name: prometheus
        state: present

    - name: Deploy updated Prometheus configuration
      copy:
        dest: "{{ prometheus_config_path }}/{{ config_file }}"
        content: |
          global:
            scrape_interval: 15s

          scrape_configs:
            - job_name: 'node_exporter'
              static_configs:
                - targets: ['server1:9100', 'server2:9100']
        owner: prometheus
        group: prometheus
        mode: '0644'
        notify: Restart Prometheus

  handlers:
    - name: Restart Prometheus
      systemd:
        name: prometheus
        state: restarted
Key metrics and aspects to monitor in containers
To maintain peak performance and resilience in containerized environments, track metrics that reflect resource consumption, network efficiency, and application behavior. Monitoring these areas helps teams proactively detect issues, optimize usage, and maintain system health.
Here are the most important metrics and signals to watch:
CPU and memory usage: Track CPU and memory consumption to identify containers under stress or wasting resources. For example, you should monitor for high usage (above 80%) or memory leaks. Use Kubernetes Horizontal Pod Autoscaler (HPA) to scale workloads or adjust container resource limits to optimize utilization.
Network traffic and performance: Measure traffic volume, latency, and packet loss to identify bottlenecks and maintain reliable communication across services. Look for latency spikes (over 100ms) or packet loss greater than 1%.
Application health and performance: Track response times, throughput, and error rates to assess production performance. Identify problematic endpoints with response times over 500ms or error rates above 5%. Apply circuit breakers and retries to maintain availability during peak loads.
Log management and analysis: Implement centralized log analysis to extract critical insights from large volumes of data and filter logs for repeated errors or anomalies. Tools like Fluentd or Loki support log aggregation and generate actionable alerts to facilitate quick team response times.
Error rates and exceptions: Monitor spikes in error rates or unhandled exceptions and trigger alerts if they exceed 2%. You can use GitOps tools like Argo CD to roll back deployments once monitoring surfaces issues.
The benefits of container monitoring
Integrating monitoring into development and operations workflows improves the performance, reliability, and security of containerized applications. These benefits help teams proactively manage issues, optimize resource usage, and meet compliance goals:
Improved application performance and reliability: Tracking key metrics, such as CPU and memory usage, enables teams to identify issues before they impact users. For example, if Prometheus reveals a container that consistently exceeds CPU limits, teams can respond by using Kubernetes HPA to scale workloads dynamically. Dynamic scaling maintains performance even during traffic spikes.
Faster issue detection and resolution: Real-time alerts enable teams to resolve problems before they escalate. Prometheus Alertmanager, for example, can notify your team in Slack when memory usage exceeds 80% for more than five minutes. This early warning system enables teams to quickly address resource constraints and minimize downtime.
Enhanced security and compliance: Monitoring access logs, traffic flows, and container behavior helps detect threats early and support compliance efforts. Fluentd, for example, can collect logs from all containers and send them to Elasticsearch for centralized analysis, enabling security teams to identify unauthorized access attempts and apply controls aligned with standards such as PCI DSS and HIPAA.
Enhance your container security with Wiz
Wiz helps you secure everything you build and run in the cloud, including containerized applications. It goes beyond monitoring by integrating prevention, detection, and response across your entire container lifecycle.
Here’s how our platform can improve your security:
Container and Kubernetes security: Secure workloads from build-time through runtime with full visibility into container and Kubernetes environments.
Vulnerability management: Discover and prioritize container vulnerabilities without agents or external scans.
Cloud security coverage: Extend security protection with built-in CNAPP capabilities, including CSPM, CWPP, and CIEM for full-stack visibility.
Continuous compliance: Automatically track misconfigurations and enforce standards like PCI, HIPAA, and GDPR.
Secured base images: Use WizOS to reduce base-image risk and maintain hardened, trusted containers.
Wiz gives your teams a secure, compliant foundation to innovate faster in the cloud. Get a demo to see how Wiz simplifies container and cloud security, or assess your Kubernetes security to see where your environment stands.
See Wiz in Action
Experience unified container and cloud security with full-stack visibility, from build to runtime.
